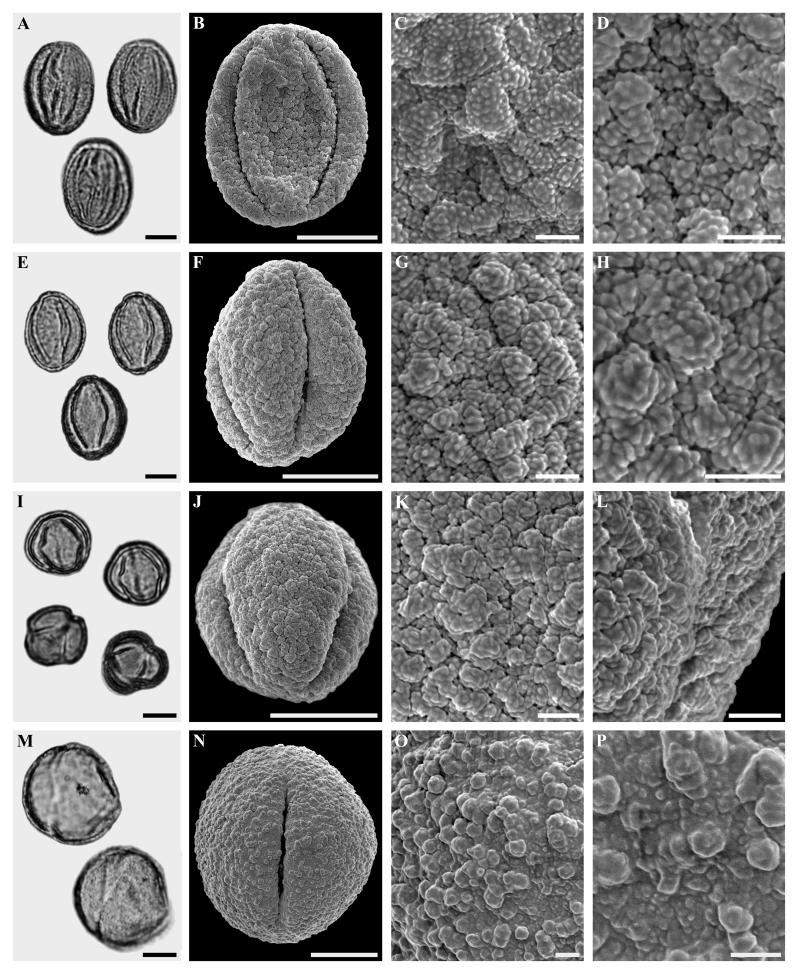
Figure 5.
A-H Quercus Group Quercus/Lobatae sp., and Quercus Group Quercus †I-P.
A-D. Quercus Group Quercus/Lobatae sp., LM and SEM micrographs from the same pollen grain. A. LM, overview. B. SEM, overview. C-D. SEM, details.
E-H. Quercus Group Quercus/Lobatae sp., LM and SEM micrographs from the same pollen grain. E. LM, overview. F. SEM, overview. G-H. SEM, details.
I-L. Quercus Group Quercus/Lobatae sp., LM and SEM micrographs from the same pollen grain. I. LM, overview. J. SEM, overview. K-L. SEM, details.
M-P. Quercus Group Quercus, LM and SEM micrographs from the same pollen grain. M. LM, overview. N. SEM, overview. O-P. SEM, details.
Scale bars = 10 μm in Figs A, B, E, F, I, J, M and N. 1 μm in Figs. C, D, G, H, K, L, O and P

