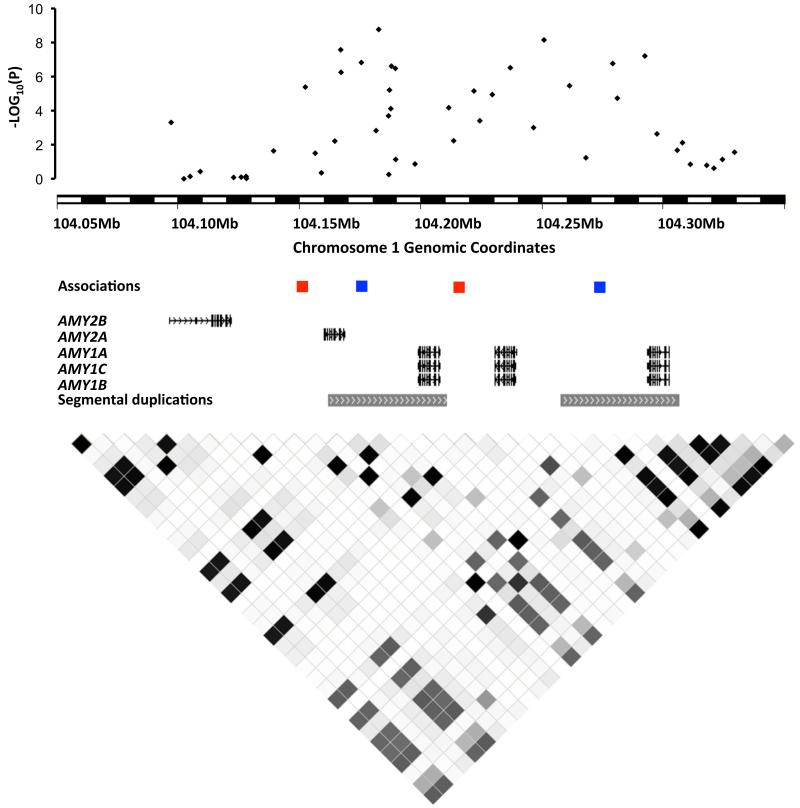
Figure 2. The amylase region in detail.
Top to bottom: famCNV association results between signal intensity at probes within 30kb of the amylase cluster and amylase expression levels (probeset 208498_s_at) in adipose tissue (black dots) in the Swedish family discovery study, with chromosomal coordinates given on the horizontal axis and minus log10(P) on the vertical axis; locations of probes showing association between signal intensity and BMI: cnvi0020639 (blue; Swedish family discovery study), cnvi0022844 (red; TwinsUK); gene content in the amylase region based on the human reference sequence (hg19; RefSeq), depicting AMY2B, AMY2A and the AMY1A/B/C genes, as well as two high sequence similarity segmental duplications in the region; LD between HapMap markers (release 23) calculated with HaploView46 (darker shading corresponds to higher r2 value). Because of the repetitive nature of this region, which contains six paralogs (including one pseudogenized copy) in the reference genome (Supplementary Figure 13), the cnvi0020639 and the cnvi0022844 probes were found to map to two locations within the amylase gene cluster.

