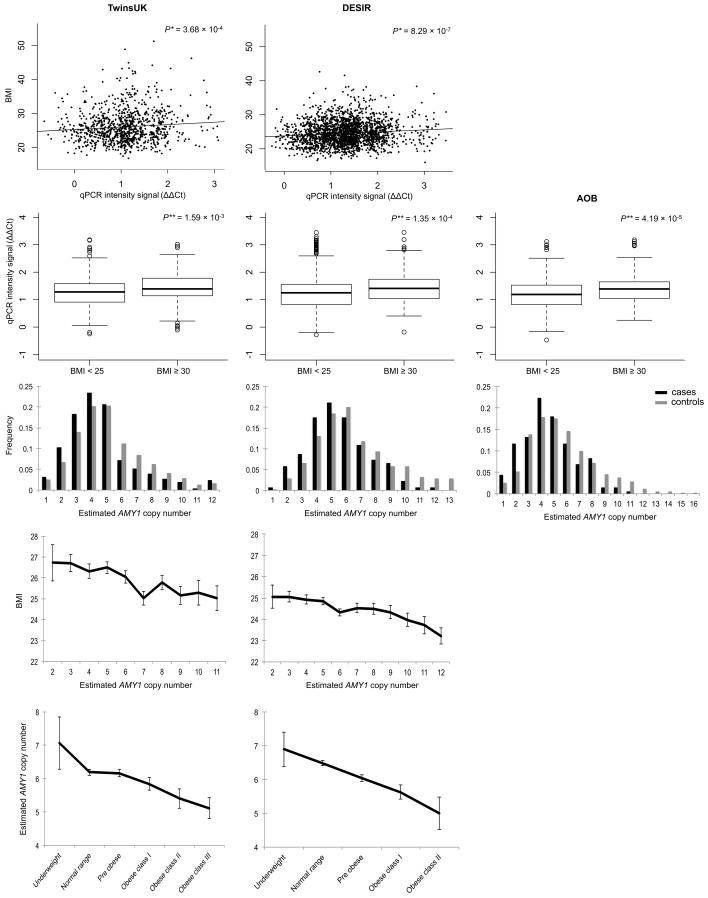
Figure 3.
Effect of estimated AMY1 copy-number on obesity and BMI. A: Scatter plots of raw qPCR signal intensity (ΔΔCt) plotted against BMI for the TwinsUK and DESIR samples. B: Boxplots of ΔΔCt in normal weight (BMI<25kg/m2) and obese (BMI≥30kg/m2) subjects in the TwinsUK, DESIR and AOB samples. For plots A and B, low ΔΔCt values correspond to high AMY1 copy-numbers. C: relative copy-number distribution in obese cases (BMI≥30 kg/m2; black bars) versus normal weight controls (BMI<25 kg/m2; grey bars) in the TwinsUK, DESIR, and AOB studies. Estimated copy-numbers higher than 13 (showing frequency < 2.5%) were collapsed together into a single category. D and E: BMI at different estimated AMY1 copy-numbers and AMY1 copy-number estimates by BMI categories in the TwinsUK and DESIR population samples. WHO BMI classification: Underweight (<18.5); Normal range (18.50 – 24.99); Pre obese (25.00 – 29.99); Obese class I (30.00 – 34.99); Obese class II (35.00 – 39.99). Error bars represent the standard error of the mean. *Association between BMI and qPCR ΔΔCt intensity signal, corrected for age, sex (DESIR), family (TwinsUK) and genotyping plate. **Wilcoxon rank sum test.

