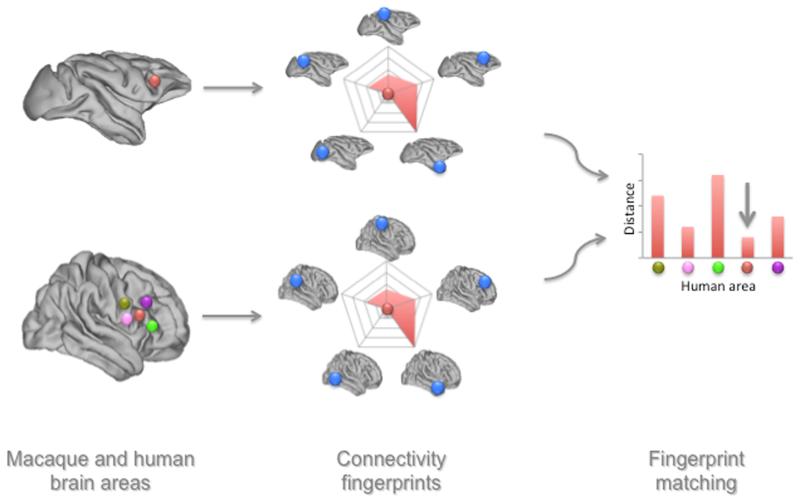
Figure 1. Schematic example of the connectivity fingerprint matching approach.
A macaque brain region (in red) is compared to multiple human brain regions (various colors in the left panel). For each of these regions, the connectivity with a predefined set of brain regions (in blue), for which the homology between the macaque and human has already been established. A difference measure between the macaque connectivity fingerprint and each of the human fingerprints is then determined. In this case, the human red area is the least dissimilar to the macaque brain region and thus the most likely candidate for homology.

