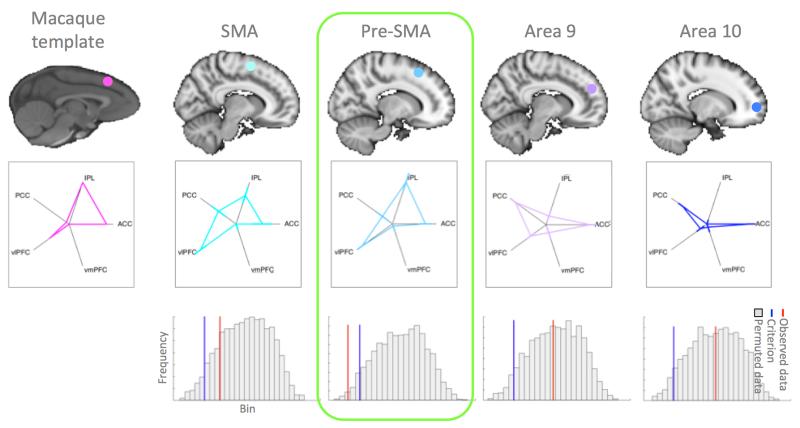
Figure 2. Matching macaque F6 connectivity fingerprint to four human areas.
(left column) Approximate anatomical location and connectivity fingerprint of the macaque template area at the anterior border of F6. (four right-hand columns) Connectivity fingerprints of four human seed areas (error bars represent ±SEM) and the results of the permutation tests showing a histogram of the distribution of the test statistic, the criterion value (blue line), and the value of the actual statistic given by the data (red line). Only in the case of pre-SMA is the actual statistic lower than the criterion, indicating a smaller difference between the area and the template than expected by chance.

