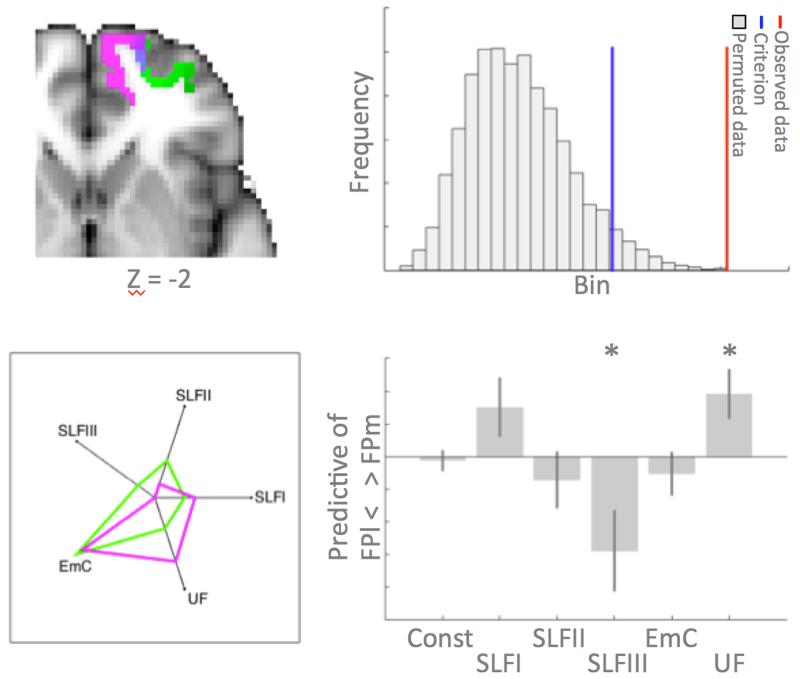
Figure 4. Connectivity fingerprint comparison between groups.
(top left) Location in MNI space of the medial (green) and lateral (pink) frontal pole. (bottom left) Connectivity fingerprint of the two areas with target areas in six longitudinal tracts. (top right) Permutation distribution of difference statistic between groups, i.e. FPm and FPl, showing the criterion value in blue and the actual statistic from the data in red. This indicates a significant difference in the connectivity fingerprint of the two areas. (bottom right) Beta weights of a logistic regression testing which tracts predict area membership (positive FPm, negative FPl), showing that SLFIII and UF explain differential variance between the two areas. * indicates significant predictive ability.

