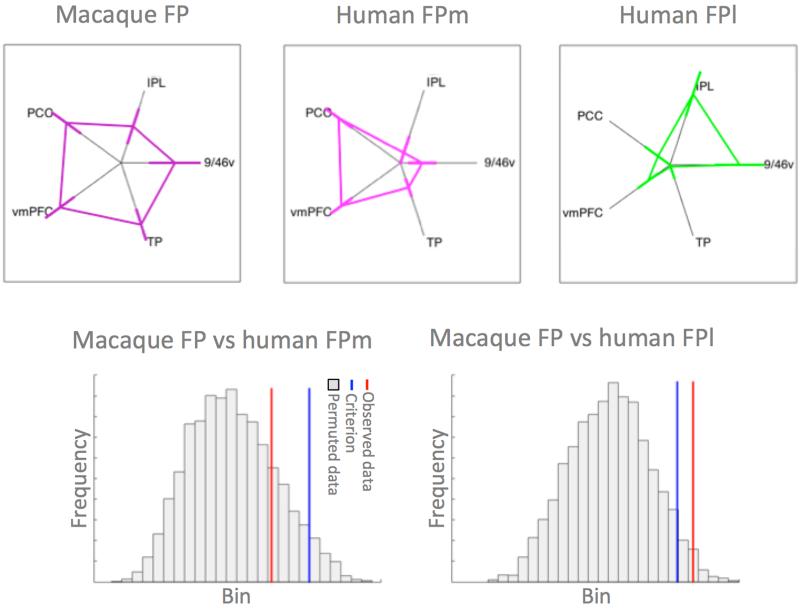
Figure 5. Comparison of human and macaque connectivity fingerprints.
(top row) Connectivity fingerprints of macaque FP (left), human FPm (middle), and human FPl (right) (error bars represent ±SEM). (bottom row) Histogram of the distribution of the test statistic comparing macaque FP and human FPm (left) and macaque FP and human FPl (right).

