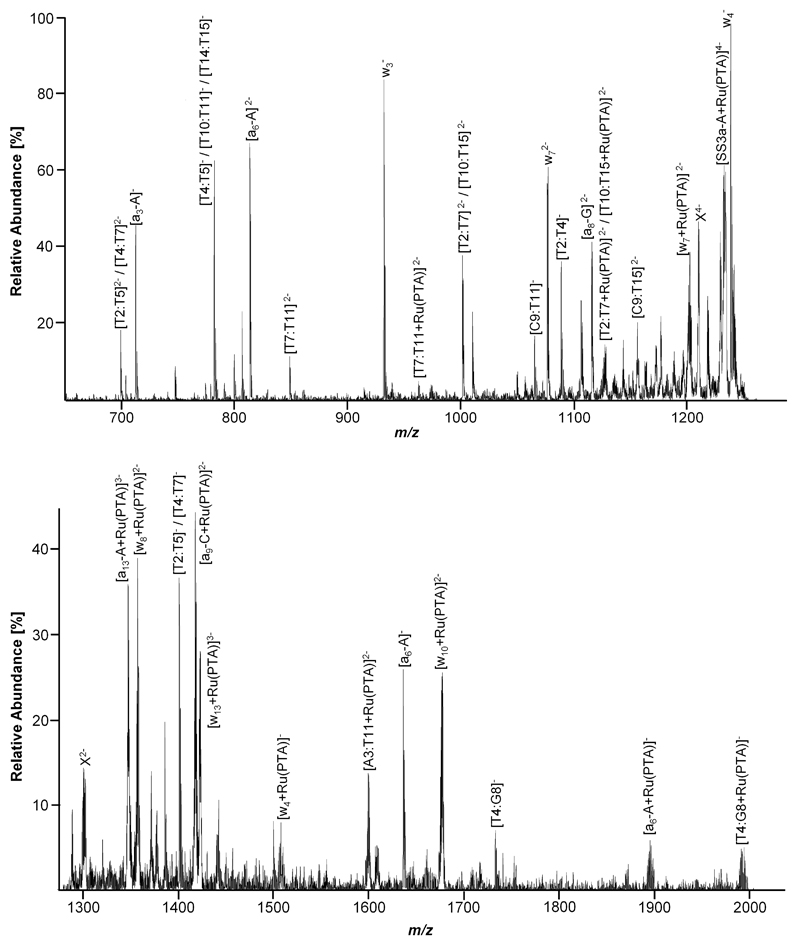
Figure 7.
Expanded segments of a LTQ CID mass spectrum of [SS3a+Ru(PTA)]4-. Top: m/z range 650 to 1275; bottom: m/z range 1275 to 2000. Unidentified fragments displaying an isotopic pattern characteristic for ruthenium are labelled X. Note that not all detected fragment ions are contained in the expanded segments for clarity.

