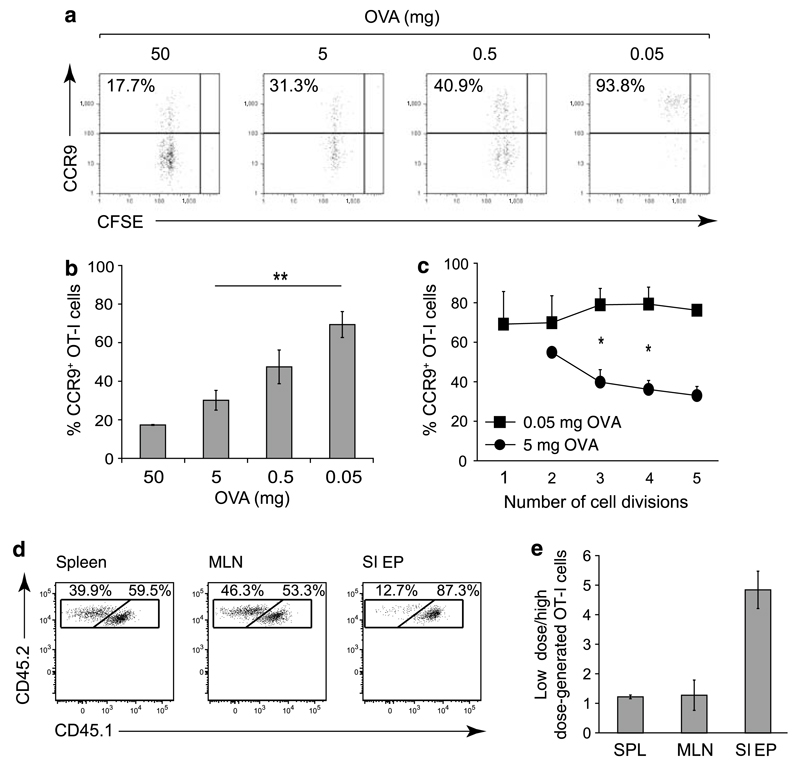
Figure 5. CCR9 induction in vivo is antigen dose dependent.
(a–c) OT-I cells (3–5×10⁶) were labeled with CFSE and transferred IV into C57BL/6-CD45.1 recipient mice, and OVA was administered IP at the doses indicated. Mice were killed 2 or 3 days later, and CCR9 expression was determined by flow cytometry. (a) Numbers represent the percentage of CCR9+ cells among responding OT-I cells. (b) Bars represent the mean±s.e.m. of the percentage CCR9+ OT-I cells (n = 2–6). **P < 0.01. (c) CCR9 expression as a function of cell division. Bars represent mean±s.e.m. of the percentage CCR9+ OT-I cells after indicated number of cell divisions (n = 2–4). *P < 0.05. (d and e) OT-I cells primed by a high antigen dose have reduced capacity to localize to the small intestinal epithelium. OT-I cells were primed in vitro with low or high antigen dose-pulsed MLN DCs and after 7 days mixed at an equal ratio and injected IV into C57BL/6-CD45.1 recipient mice. The ratio of low dose-primed OT-I cells (CD45.1+ CD45.2+) and high dose-primed OT-I cells (CD45.1− CD45.2+) was assessed in the spleen, MLN, and small intestinal epithelium after 24 h by flow cytometry. (d) Representative flow cytometry analysis of transferred OT-I cells in the spleen, MLN, and small intestinal epithelium after gating on donor cells. (e) Bars represent mean±s.d. of the ratio of low-dose/high-dose-generated cells after normalization to the input ratio (n = 3). CCR, CC chemokine receptor; DC, dendritic cell; IP, intraperitoneally; IV, intravenously; MLN, mesenteric lymph node; OVA, ovalbumin; SIEP, small intestinal epithelium; SPL, spleen.

