Abstract
Purpose
To investigate Equilibrium contrast MRI (EQ-MRI) measurement of extracellular volume fraction (ECV) within healthy abdominal tissues; and test the hypotheses that tissue ECV in systemic amyloid light-chain (AL) amyloidosis is greater than in health; and that this increase tracks organ amyloid burden.
Materials and Methods
A local ethics committee approved the study and all subjects gave written informed consent. Forty healthy volunteers (18 male; 22 female; median age 43; range 24-88 years) and sixty seven patients with AL amyloidosis (43 male; 24 female; median age 65; Range 38-81 years) underwent EQ-MRI of the upper abdomen. ECV was measured in the liver, spleen and paravertebral muscle. Amyloidosis patients also underwent serum amyloid P component (SAP) scintigraphy to score specific organ involvement by amyloid. Variation in ECV between tissues was assessed using a Friedman Test. Tissue ECV in healthy and amyloidosis groups were compared using a Mann-Whitney U test. Spearman correlation was used to test for an association between organ SAP score and ECV.
Results
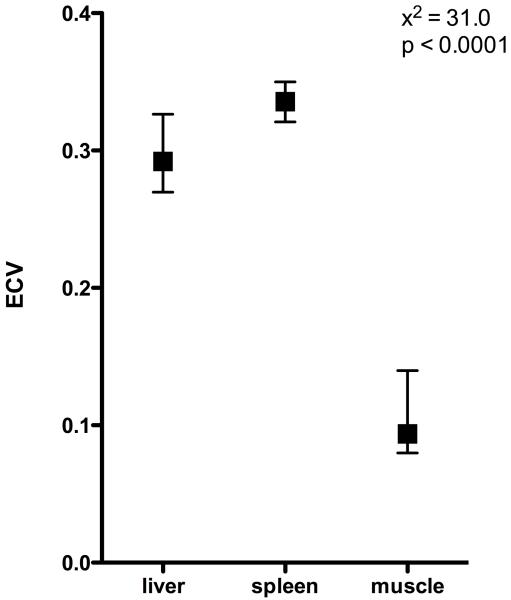
ECV measured by EQ-MRI varied significantly between organs in healthy volunteers (x2=31.0, p<0.0001). ECV was highest in the spleen (0.34), followed by liver (0.29) and muscle (0.09). ECV measured within the spleen (0.39), liver (0.31) and muscle (0.16) was significantly higher (Pspleen<0.0001, Pliver=0.0054, Pmuscle<0.0001) in patients with amyloidosis than healthy controls. ECV measured in the liver and spleen tracked increasing organ amyloid burden assessed by SAP scintigraphy (liver: rs=0.54; spleen: rs=0.57).
Conclusions
EQ-MRI can be used to define ECV within healthy tissues. ECV is increased in amyloidosis compared with healthy tissues and this increase tracks rising tissue amyloid burden.
Keywords: MR-imaging, liver, spleen, contrast agents, tissue characterization
INTRODUCTION
All multicellular organisms are composed of an array of metabolically active cells supported by an extracellular framework. In health, this architecture provides the medium through which cells exchange components necessary for intra cellular metabolism, and can contribute, physically and metabolically, to the function of their constituent tissue. In disease and senescence this alters. Cell injury and inflammation leads to fibrosis with expansion of the interstitium and reduction in cellularity. This fibrosis can occur either focally, leading to ‘scar’ or diffusely affecting whole organs. Common examples of diffuse fibrosis that may ultimately lead to organ failure include pulmonary fibrosis and liver cirrhosis.
The interstitium frequently plays a more substantial and often under recognized role in disease. For example, in the heart, pathologists identify disease states such as ‘idiopathic myocardial fibrosis’ (1) (2) that are virtually unrecognized clinically. One reason for this is an inability to reliably and accurately quantify the interstitium. The reference standard of invasive tissue biopsy is limited by its technical difficulty, complication rate, and sampling error (3). This has led to the development of a number of non-invasive tests (4) including biomarkers and tissue elastography (5) (6) (7), however these are frequently organ specific or suffer from similar sampling error.
Recently new techniques have been developed for cardiac investigation based on Cardiovascular Magnetic Resonance T1 mapping. One implementation, Equilibrium Contrast CMR (EQ-CMR) (8) is based on 3 elements: administration of a purely extracellular contrast agent such as Gadolinium (Gd-DTPA) to achieve equilibrium between blood and tissue concentrations, thus eliminating the effect of contrast kinetics; imaging before and after contrast equilibrium to measure the produced change in signal; and a blood test to measure the extracellular volume fraction within blood. Tissue ECV can then be simply calculated using the formula:
where Δ R1=(1÷T1)post contrast - (1÷T1)pre contrast
This technique is currently being used to explore cardiac interstitial expansion in health and disease (9) mainly by diffuse fibrosis, but also in cardiac amyloidosis where interstitial expansion is caused by the deposition of extracellular amyloid fibrils. Interstitial expansion here can be massive and difficult to measure – the only conventional non-invasive quantitative test being serum amyloid P (SAP) scintigraphy (10) which does not work in the heart (11).
However when the heart is at contrast equilibrium, so too are other tissues excluding privileged sites such as structures behind the blood:brain barrier. This raises the possibility of extending the technique to EQ-MRI rather than simply EQ-CMR.
The purpose of our study was too to investigate Equilibrium contrast MRI (EQ-MRI) measurement of extracellular volume fraction (ECV) within healthy abdominal tissues; and test the hypotheses that tissue ECV in systemic AL Amyloidosis is greater than in health; and that this increase tracks organ amyloid burden.
Materials and Methods
Local ethics committee approval was obtained and all participants provided informed written consent.
Clinical Validation
Recruitment
Healthy volunteers were recruited as part of on going studies looking at ECV in health and disease at our institution. Amyloid patients were recruited specifically for this and a parallel study examining EQ-CMR in the heart (results published elsewhere (12)). Recruitment took place between November 2010 and January 2012. Forty healthy volunteers (18 male; 22 female; median age 43; range 24-88 years) were recruited through advertising within the hospitals, university and general practitioner surgeries. Healthy subjects had no previous history of cardiac or liver disease.
Consecutive patients with systemic AL amyloidosis (n=90) were identified from the National Amyloidosis Centre clinic. Inclusion criterion was biopsy proven AL amyloidosis demonstrated by Congo red and immunospecific staining. Biopsies were from various sites including kidney, heart, liver and soft tissue depending on the individual patient’s clinical presentation.
Exclusion criteria were renal impairment defined as an estimated glomerular filtration rate (eGFR) <30ml/min or a contraindication to standard MRI. 18 patients were excluded due to abnormal renal function, 4 had pacemakers, and 1 suffered with claustrophobia. The remaining 67 patients (43 male; 24 female; median age 65 years, range 38-81) were recruited to the study. Subjects in the amyloidosis group contained a greater proportion of men and were on average older (P<0.0001) than the healthy volunteer group.
EQ-MRI ECV Measurement
EQ-MRI was performed using a 1.5T magnet (Siemens medical solutions, Avanto, 16 channel coil). T1 was measured using an inversion recovery technique previously used and validated by Flett et al (8). This is a multi–breath-hold, spoiled gradient echo, fast low angle shot (FLASH) inversion recovery (IR) sequence with the following parameters: slice thickness 8mm, TR 2000ms, TE 3.15ms, flip angle=21°, field of view 400×260mm, increasing inversion times (TI) per breath-hold of 140 ms, then 200 to 1000 ms in 100-ms increments subsequently corrected for repeat time (8) – table 1.
Table 1. Summary of MRI sequence parameters.
| FLASH GRE | |
|---|---|
| TR | 2000ms |
| TE | 3.15ms |
| Flip angle | 21° |
| FoV read | 400mm |
| FoV phase | 260mm |
| Slice thickness | 8mm |
| Inversion times | 140, 200-1000ms |
Immediately prior to the EQ-MRI a sample of blood was drawn and sent for complete blood count (CBC) analysis, and the subject briefed on consistent breath holding. A member of the research team used axial, saggital and coronal plane localisers to plan an axial slice through the upper abdomen to include the greatest area of liver and spleen. Pre-contrast FLASH images were acquired at this location for T1 measurement with inversion times increasing from 140 to 200ms and then to 1000ms in 100ms increments.
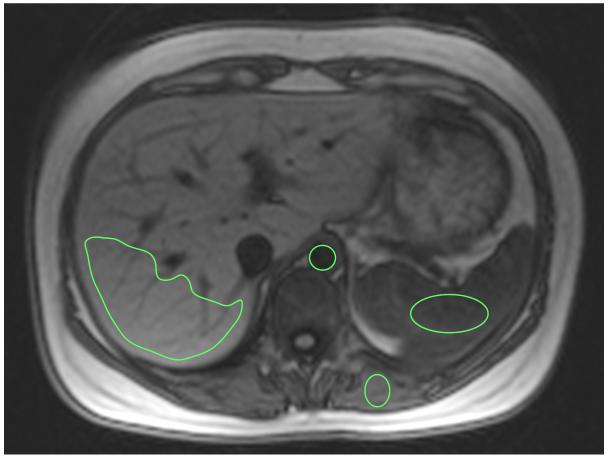
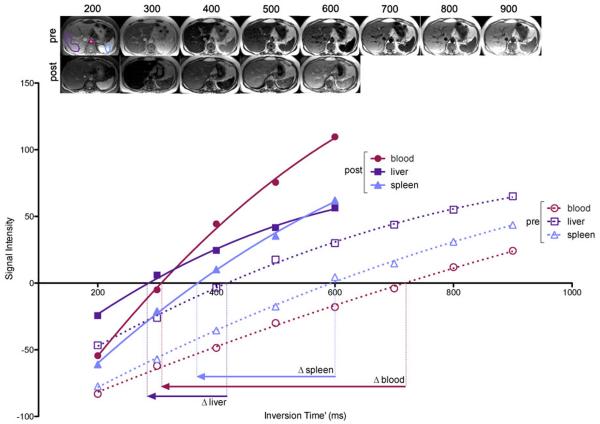
A bolus and infusion of contrast was then administered to achieve equilibrium using parameters validated previously (8). As static steady state using this protocol had been previously verified only in the heart, we performed a preliminary experiment to confirm that the bolus plus infusion parameters produced static contrast equilibrium in other organs – see appendix 1. A bolus of 0.1 mmol/kg Gd-DTPA (Dotarem; Guerbet) was used with a 20ml normal saline flush at 3ml/s, after which the subject was allowed to leave the scanner table to sit in a chair. Following a 15-minute pause, an infusion of Gd at 0.0011 mmol/kg/min (equivalent to 0.1 mmol/kg over 90 minutes) was started. At 45 to 55 minutes post bolus, i.e. during contrast equilibrium (EQ), the patient was returned to the scanner and a further set of FLASH images acquired for T1 measurement (TI 200 to 600ms) at a similar location to the pre-contrast images (Fig 1). Matching of slice locations was done visually by the supervising research team member (S.M.B,) – a cardiologist with 4 years experience in cardiac imaging. Mean tissue T1 relaxation time was then measured within the selected tissues at both time points as described below. Scan analysis was performed by a radiologist (S.B.) with 6 years experience who was blinded to all clinical data. Region of interest (ROI) analysis was performed using OsiriX (Pixmeo SARL, Switzerland). Beginning with the equilibrium phase data, the image with the greatest soft tissue contrast was visually selected. Single ROIs were then drawn in each of the 4 tissues of interest. A circular ROI was drawn in the abdominal aorta (mean=136mm2, range 81-358mm2) so as to include the greatest area of lumen, but not include aortic wall – frequently thickened by atheroma. In the liver, a single large peripherally based, wedge shaped polygonal ROI was drawn in liver segment 6 and 7 (mean= 2938mm2, range 1268-3281mm2) so as to include the maximum area of liver tissue but avoid visible hepatic and portal veins. Elliptical ROIs were also drawn in the spleen (mean= 672mm2, range 213-842mm2) and paravertebral muscle (mean= 92mm2, range 35-104mm2) to include the maximum area of tissue and void adjacent vessels and fat (fig 2). The 4 ROIs were then copied to the other EQ phase FLASH images and mean signal intensity within each tissue at each inversion time recorded. Mean tissue signal intensities were then plotted against inversion time. The inversion time producing the lowest signal intensity was identified and the sign of signal intensities plotted to the left of this point made negative. This allowed reconstruction of the full range of the T1 signal intensity inversion recovery curve. A second-order polynomial curve-fitting technique was used to find the null point (Fig 3). A previously validated (8) algorithm was then used to correct for incomplete longitudinal recovery giving a corrected T1.
Figure 1. Schematic of the EQ-MRI scan protocol - including time segments for pre and post contrast clinical sequences, which would be included in a full clinical scan but were not part of the experimental protocol.
Figure 2. Pre contrast axial image (TI=800ms) showing example regions of interest drawn within the abdominal aorta, spleen, liver and paravertebral muscle.
Figure 3. FLASH images acquired at increasing inversion times and tissue signal intensity plotted with phase restored.
From the inversion recovery curves, change in TI′ can be determined, allowing ECV for that tissue to be calculated.
Following measurement of tissue T1 at the EQ phase, ROIs were copied to the pre-contrast images with manual adjustment of the ROI position where needed.
Where an organ was incompletely scanned on either phase, or images degraded by breathing or wrap around artefact such that measurement of reliable signal intensity was deemed not possible by the observer, data for the organ in that individual was excluded.
Using the pre-contrast and EQ phase mean T1 relaxation times, and hematocrit measured from the CBC, ECV fraction within each tissue was calculated using the formula: ECV = (1−haematocrit) × (Δ R1tissue ÷ Δ R1blood)
where Δ R1=(1÷T1)EQ phase − (1÷T1)pre contrast
SAP Scintigraphy
All patients with amyloidosis underwent amyloid I 123-labelled SAP scintigraphy (13) as part of their routine assessment at the National Amyloidosis Centre. SAP imaging was performed within 8 weeks of the EQ-MRI. Anterior and posterior whole body images and were acquired using a GE Infinia gamma camera and medium energy collimator, 24 hours after administration of 200 MBq 123I-SAP.
Total body, liver and splenic amyloid burden were scored by visual assessment (0=no involvement; 1=small; 2=moderate; 3=large) (14) by a single physician (PH) with over 25 years experience in SAP imaging.
Statistical analyses
The Prism statistical package: version 5 (Graphpad Software Inc., San Diego, CA) was used for all data analysis. Normal distribution was assessed using the Kolmogorov-Smirnov test. Variation in ECV between matched organs was assessed using the Friedman test for both the healthy subjects and patients with amyloidosis.
Liver, spleen and muscle ECV measurements in healthy volunteers followed a non-Gaussian distribution and were compared with those in the amyloidosis population using a Mann-Whitney U test.
Variation in ECV across SAP scores was assessed using a Kruskal-Wallis test for both the liver and spleen. In order to examine for an association between ECV and SAP score in the liver and spleen we performed Spearman correlation analysis, computing a one tailed P-value to assess significance.
Results
EQ-MRI was attempted in all 40 volunteers and 67 amyloidosis patients but due to scan time limitations, patient discomfort, breathing and wrap around artefacts and previous surgical resections complete imaging was available for the liver, spleen and paravertebral muscle in 35, 32 and 34 healthy volunteers; and 56, 48 and 53 amyloidosis patients respectively. Imaging of all 3 tissues was available in 30 healthy volunteers and 46 amyloidosis patients.
EQ-MRI demonstrated a significant difference (p<0.0001) in median ECV between healthy liver, spleen and paravertebral muscle (median[IQR]= 0.29[0.27-0.33], 0.34[0.32-.35] and 0.09[0.08-0.14] respectively, figure 4).
Figure 4. Tissue ECV (median and IQR) in healthy volunteers.
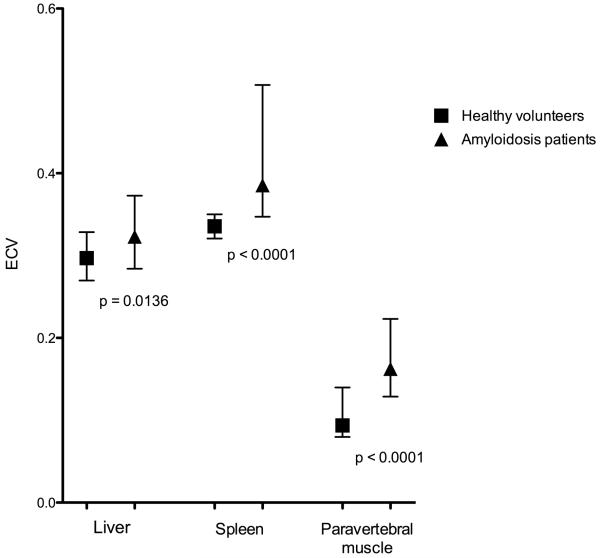
In amyloidosis the median ECVs also varied significantly (p<0.0001) between liver, spleen and paravertebral muscle (median[IQR]= 0.32[0.28-0.37], 0.39[0.35-0.51] and 0.16[0.13-0.22] respectively). There was a statistically significant (Pspleen<0.0001, Pliver=0.0054, Pmuscle<0.0001) increase in the ECV of all organs in the amyloidosis group compared with health volunteers (figure 5).
Figure 5. Comparison of healthy subjects and amyloidosis patient ECV (median and IQR) measured in the liver, spleen and paravertebral muscle.
56 patients underwent matched liver EQ-MRI ECV measurement and SAP scintigraphy. 16 of these cases were excluded - in 15 cases SAP imaging demonstrated a congested liver pattern, i.e. an increased blood-pool signal associated with cardiac failure, and in 1 case localization of the tracer was equivocal. 29 patients scored 0 on SAP; 5 scored 2 and 6 scored 3.
48 patients underwent matched splenic ECV measurement and SAP scintigraphy. 6 cases were excluded as SAP activity was scored as equivocal. 22 patients scored 0 on SAP; 8 scored 1; 7 scored 2 and 5 scored 3.
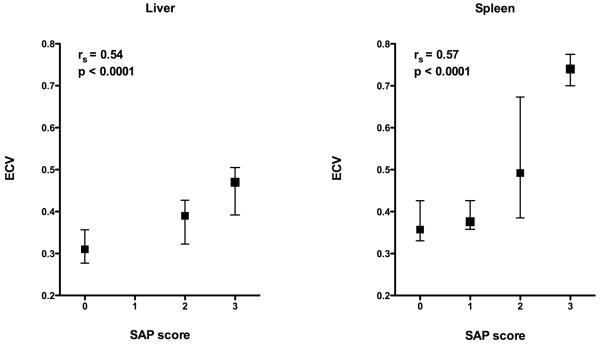
There was a significant difference in ECV between SAP scores in both the liver (P=0.0005) and spleen (P=0.0014). ECV increased with SAP score in both the liver and spleen. There was a positive correlation between ECV and SAP score in both the liver (rs=0.54,) and spleen (rs=0.57, figure 6).
Figure 6. ECV (median and SD) by SAP score in the liver and spleen demonstrating increasing ECV with SAP.
Discussion
In this study we have used EQ-MRI to define ECV in healthy tissues; and document variation in ECV between tissues. Such data is vital if ECV is to be used to detect pathological processes. We have then shown significant differences in a disease process that exemplifies expansion of the extracellular space - systemic AL amyloidosis. This provides strong proof of concept that the equilibrium techniques can be successfully applied outside the heart.
Although evidence exists that changes in the extracellular space may be a useful indicator of disease severity and treatment response (15), few existing techniques are able to quantify this space.
The ideal comparator for this study would have been histological assessment of the extracellular space. Histological techniques do exist to quantify extracellular collagen matrix; and applied to the liver, automated collagen proportionate area measurement has shown good association with other indices of diffuse liver fibrosis (16). However collagen proportionate area measurements in the healthy liver are in the order of 2-3% (17) – much lower than our ECV estimate. This difference is likely to be due to the fact that the extracellular collagen matrix occupies only part of the extracellular space within the liver. Current histological techniques are unable to directly measure the ECV as the process of tissue sampling and preparation almost certainly alters tissue ECV.
As many pharmaceutical products distribute exclusively within interstitial space, some pharmacokinetic model based ECV estimates exist. Levitt (18) collected data from earlier experiments to produce a physiologically based pharmacokinetic model; estimating the EC fraction in organs of a hypothetical standard human. He estimated the EC fluid fraction with the liver and muscle to be 0.23 and 0.15.
DCE-MRI has been used more recently to quantify the extracellular space and evaluate changes in response to treatment using a tumour disease model (19). DCE-MRI is however a complex technique, prone to substantial measurement error and application is limited to only one tissue site (20). A direct comparison of EQ-MRI and DCE-MRI ECV quantification has yet to be made, however other authors using DCE-MRI have reported ECV in the healthy liver as 0.2-0.3 (15) and skeletal muscle as 0.106-0.115 (21). The estimates of ECV from pharmacokinetic modelling and DCE-MRI are broadly consistent with each other, and with our EQ-MRI results.
In this study, comparison is made with a disease specific in vivo probe for extracellular (amyloid) protein deposition. Serum amyloid P component scintigraphy is the current reference standard method for evaluation of systemic amyloidosis and has enabled wider assessment of organ amyloid involvement. Unlike histology, it can be used to track changes in whole organs over time. These results demonstrate that an increase in tissue amyloid burden assessed by SAP scintigraphy is associated with an increase in tissue ECV. EQ-MRI may then provide a useful non-invasive tool for amyloid assessment and potentially therapeutic monitoring.
Disease evaluation and quantitation using SAP scintigraphy however requires specific expertise and is only available in highly specialized centres. The high atomic mass of the SAP molecule (125 kDa) also favours evaluation in tissues with a fenestrated endothelium (such as the liver and spleen), where the large molecule is able to pass into the interstitium. Hence SAP scintigraphy provides little information about amyloid deposition in tissues such as skeletal muscle and myocardium.
This study had several limitations. The FLASH IR based T1 mapping technique used was complicated, time consuming and prone to error. To minimise possible variation in slice position during the multi breath hold acquisitions, careful subject coaching was necessary. Other sources of error were copying of ROIs, which required individual adjustment; and the restoration of signal intensity phase around the null inversion time, which was subjectively assessed to match the curve fit. Technical improvements in T1 mapping, for example the ‘Shortened Modified Look Locker Inversion recovery’ sequence (22) allows faster and more robust tissue ECV mapping; albeit within a single slice per breath hold. Although the bolus plus infusion protocol used in this study provided a steady state equilibrium in all tissues of interest, prolonged contrast infusions are not practical for clinical imaging. Preliminary experimental findings concur with other authors (8) in showing steady state equilibration is reached approximately 15 to 20 minutes after administration of contrast bolus plus infusion. Future protocols may then incorporate equilibrium phase imaging after a shorter delay than was used here. In rapidly equilibrating tissues such as the myocardium, a bolus only dynamic contrast equilibrium approach can be used to estimate ECV with even shorter scan times (23). EQ-MRI evaluation of ECV is also not specific to disease aetiology. As well as amyloid deposition and diffuse fibrosis, tissue ECV may be elevated by interstitial edema or an inflammatory infiltrate. Although these potential confounders could not be specifically excluded in this study, cases demonstrating a congested pattern of activity on SAP scintigraphy were excluded from the SAP/ECV correlation.
It is noted that healthy volunteer and amyloidosis patients groups were not age and gender matched. Sado et al. (24) showed that mean myocardial ECV in healthy females was 4% higher than in healthy men; with no change with age. This has not been assessed in other organs. In this study, the higher female proportion in the healthy group M(18):F(22) compared with the amyloidosis group M(43):F(24) may have reduced the difference in mean ECV measured between these groups. In order to minimise such bias, future studies should ensure that groups are gender matched.
Having assessed EQ-MRI in one disease, it is worth noting that amyloidosis forms part of a larger set of conditions where EC disruption and expansion leads to organ dysfunction. Diffuse fibrosis is a ubiquitous process of interstitial collagen deposition, occurring in response to diffuse tissue injury as well as in senescence. Many of the conditions where this process can be identified histologically; for example diffuse myocardial fibrosis and liver cirrhosis, have huge population significance. The application of EQ imaging in these organs could potentially provide a new biomarker for disease evaluation.
Advances in knowledge
Equilibrium MRI can measure extracellular volume fraction (ECV) in various tissues including the liver, spleen and muscle
ECV increases with amyloid tissue burden assessed by serum amyloid P component (SAP) scintigraphy (liver: rs=0.54, p<0.0001; spleen: rs=0.57, p<0.0001).
Implications for patient care (up to 3)
EQ-MRI may provide a useful tool for diagnosis and treatment monitoring in diseases which induce diffuse fibrosis or amyloid deposition
EQ-MRI may represent an alternative to invasive tissue biopsy for tissue evaluation when tissue sampling is technically difficult or associated with substantial risk – for example in the heart or in patients with a coagulopathy.
Summary Statement
EQ-MRI can be used to define ECV within healthy tissues. ECV is increased in amyloidosis compared with healthy tissues and this increase tracks rising tissue amyloid burden.
Funding
This work was undertaken at the Comprehensive Biomedical Research Centre, University College Hospital London, which received a proportion of the funding from the National Institute for Health Research. The views expressed in this publication are those of the authors and not necessarily those of the UK Department of Health
This article/paper/report presents independent research funded by the National Institute for Health Research (NIHR). The views expressed are those of the author(s) and not necessarily those of the NHS, the NIHR or the Department of Health.
S.B. is funded by a National Institute for Health Research, UK Doctoral Research Fellowship.
APPENDIX 1: Confirming Steady State Equilibrium
Previous studies have confirmed contrast equilibrium within the myocardium. Before applying the EQ technique to other organs we performed a preliminary experiment to test if the Gd bolus plus infusion (B/I) protocol described (8) would also produce contrast equilibrium within the liver, spleen and muscle.
2 healthy volunteers (both male; aged 35 and 42 years) were given a bolus of 0.1 mmol/kg Gd-DTPA (Dotarem; Guerbet) with a 20ml normal saline flush at 3ml/s. After a 15-minute pause, an infusion of Gd at 0.0011 mmol/kg/min (equivalent to 0.1 mmol/kg over 90 minutes) was started.
For comparison a further healthy volunteer received only a bolus of 0.1 mmol/kg Gd-DTPA with a 20ml normal saline flush at 3ml/s.
MRI was then used to measure the change in tissue signal intensity for a period of 55 minutes from the point of bolus injection:
Axial, sagittal and coronal plane localisers were used to plan an axial slice through the lower abdomen to include the largest section of liver and spleen and a 4 chamber view of the heart. For rapid within-subject T1 measurement, a TI (time to inversion) scout steady-state free precession sequence was used (TR=1.27; TE=1.27ms; slice thickness 8mm, flip angle 30°; TI= 105 to RR interval) to measure TI′ (TI prime, the TI without heart rate or readout correction (i.e. a reliable reflection of intrasubject T1 variation over time), at the selected slice every 5 minutes. TI′ signal intensity was measured within regions of interest (ROI) drawn in the blood, myocardium, liver and biceps muscle (see EQ-MRI ECV measurement for ROI drawing method). Steady state was defined within a tissue as a variation in signal intensity of less than 5% between 3 consecutive TI′ readings.
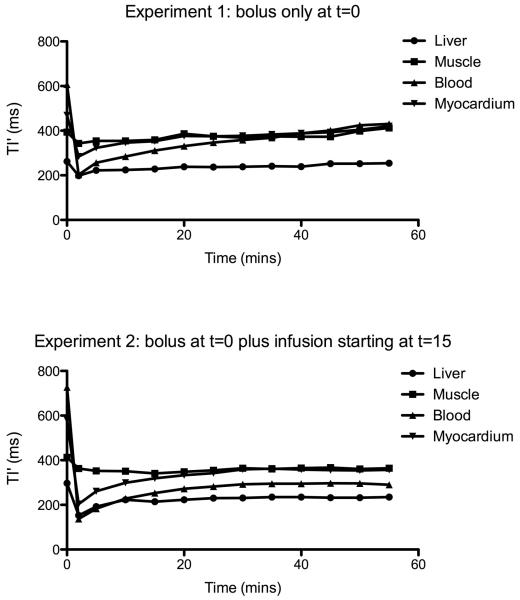
In our preliminary experiment, contrast equilibrium was achieved in the liver, biceps muscle, blood and myocardium in both volunteers with bolus and infusion by 25 minutes. In comparison, the volunteer given only a bolus of contrast failed to reach equilibrium within the blood, muscle and myocardium. After a steep fall immediately following the contrast bolus injection, TI′ rose steadily back towards its pre-contrast value. A similar pattern was seen in the liver but the increase was slow compared to other organs, and from 25 minutes the change in TI′ was less than 5% between consecutive time points – Fig A-1.
Figure A.1. Blood and tissue TI′ measured following (1) contrast bolus only in a xx year old healthy male and (2) bolus plus infusion from t=15mins in a xx year old healthy male.
The plot demonstrates the effect of the infusion on TI′ – which directly relates to T1 and therefore maps contrast concentration change over time.
References
- 1.Anderson K, Sutton M. Histopathological types of cardiac fibrosis in myocardial disease. J. Pathol. 1979 Jun;128(2):79–85. doi: 10.1002/path.1711280205. [DOI] [PubMed] [Google Scholar]
- 2.Tanaka M, Fujiwara H, Onodera T, Wu DJ, Hamashima Y, Kawai C. Quantitative analysis of myocardial fibrosis in normals, hypertensive hearts, and hypertrophic cardiomyopathy. Br. Heart J. 1986 Jun;55(6):575–81. doi: 10.1136/hrt.55.6.575. [DOI] [PMC free article] [PubMed] [Google Scholar]
- 3.Gilmore I, Burroughs A, Murray-Lyon I. Indications, methods, and outcomes of percutaneous liver biopsy in England and Wales: an audit by the British Society of Gastroenterology and the Royal College of. Gut. 1995 Mar;36(3):437–41. doi: 10.1136/gut.36.3.437. [DOI] [PMC free article] [PubMed] [Google Scholar]
- 4.Ronot M, Asselah T, Paradis V, Michoux N, Dorvillius M, Baron G, et al. Liver Fibrosis in Chronic Hepatitis C Virus Infection: Differentiating Minimal from Intermediate Fibrosis with Perfusion CT. Radiology. 2010;256(1):135–42. doi: 10.1148/radiol.10091295. [DOI] [PubMed] [Google Scholar]
- 5.Friedrich-Rust M, Ong M-F, Martens S, Sarrazin C, Bojunga J, Zeuzem S, et al. Performance of transient elastography for the staging of liver fibrosis: a meta-analysis. Gastroenterology. 2008 Apr;134(4):960–74. doi: 10.1053/j.gastro.2008.01.034. [DOI] [PubMed] [Google Scholar]
- 6.Loustaud-Ratti VR, Cypierre A, Rousseau A, Yagoubi F, Abraham J, Fauchais A-L, et al. Non-invasive detection of hepatic amyloidosis: FibroScan, a new tool. Amyloid. 2011 Mar;18(1):19–24. doi: 10.3109/13506129.2010.543443. [DOI] [PubMed] [Google Scholar]
- 7.Huwart L, Sempoux C, Salameh N, Jamart J. Liver Fibrosis : Noninvasive Assessment with MR Elastography versus Aspartate Aminotransferase-to-Platelet Ratio Index. Radiology. 2007;245(2) doi: 10.1148/radiol.2452061673. [DOI] [PubMed] [Google Scholar]
- 8.Flett AS, Hayward MP, Ashworth MT, Hansen MS, Taylor AM, Elliott PM, et al. Equilibrium contrast cardiovascular magnetic resonance for the measurement of diffuse myocardial fibrosis: preliminary validation in humans. Circulation. 2010 Jul 13;122(2):138–44. doi: 10.1161/CIRCULATIONAHA.109.930636. [DOI] [PubMed] [Google Scholar]
- 9.Sado DM, Flett AS, Moon JC. Novel imaging techniques for diffuse myocardial fibrosis. Future Cardiol. 2011;7(5):643–50. doi: 10.2217/fca.11.45. [DOI] [PubMed] [Google Scholar]
- 10.Hawkins PN, Myers MJ, Lavender JP, Pepys MB. Diagnostic radionuclide imaging of amyloid: Biological targeting by circulating human serum amyloid P component. Lancet. 1988 Jun;1(8600):1413–8. doi: 10.1016/s0140-6736(88)92235-0. [DOI] [PubMed] [Google Scholar]
- 11.Hawkins PN, Richardson S, MacSweeney JE, King a D, Vigushin DM, Lavender JP, et al. Scintigraphic quantification and serial monitoring of human visceral amyloid deposits provide evidence for turnover and regression. Q J Med. 1993 Jun;86(6):365–74. [PubMed] [Google Scholar]
- 12.Banypersad SM, Sado DM, Flett AS, Gibbs SDJ, Pinney JH, Maestrini V, et al. Quantification of Myocardial Extracellular Volume Fraction in Systemic AL Amyloidosis: An Equilibrium Contrast Cardiovascular Magnetic Resonance Study. Circulation. Cardiovascular imaging. 2013;6:34–39. doi: 10.1161/CIRCIMAGING.112.978627. [DOI] [PubMed] [Google Scholar]
- 13.Hawkins P, Lavender J, Pepys M. Evaluation of systemic amyloidosis by scintigraphy with 123I-labeled serum amyloid P component. N. Engl. J. Med. 1990;323(8):508–13. doi: 10.1056/NEJM199008233230803. [DOI] [PubMed] [Google Scholar]
- 14.Rydh A, Suhr O, Hietala S. Serum amyloid P component scintigraphy in familial amyloid polyneuropathy: regression of visceral amyloid following liver transplantation. Eur J Nucl Med. 1998;25(7) doi: 10.1007/s002590050273. [DOI] [PubMed] [Google Scholar]
- 15.Orton MR, Miyazaki K, Koh D-M, Collins DJ, Hawkes DJ, Atkinson D, et al. Optimizing functional parameter accuracy for breath-hold DCE-MRI of liver tumours. Phys. Med. Biol. 2009 Apr 7;54(7):2197–215. doi: 10.1088/0031-9155/54/7/023. [DOI] [PubMed] [Google Scholar]
- 16.Calvaruso V, Burroughs AK, Standish R, Manousou P, Grillo F, Leandro G, et al. Computer-assisted image analysis of liver collagen: relationship to Ishak scoring and hepatic venous pressure gradient. Hepatology. 2009 Apr;49(4):1236–44. doi: 10.1002/hep.22745. [DOI] [PubMed] [Google Scholar]
- 17.Standish RA, Cholongitas E, Dhillon a P, Burroughs a K. An appraisal of the histopathological assessment of liver fibrosis. Gut. 2006 Apr;55(4):569–78. doi: 10.1136/gut.2005.084475. [DOI] [PMC free article] [PubMed] [Google Scholar]
- 18.Levitt DG. The pharmacokinetics of the interstitial space in humans. BMC Clin Pharmacol. 2003 Jul 30;3:3. doi: 10.1186/1472-6904-3-3. [DOI] [PMC free article] [PubMed] [Google Scholar]
- 19.Benjaminsen IC, Brurberg KG, Ruud E-BM, Rofstad EK. Assessment of extravascular extracellular space fraction in human melanoma xenografts by DCE-MRI and kinetic modeling. Magn Reson Imaging. 2008 Feb;26(2):160–70. doi: 10.1016/j.mri.2007.06.003. [DOI] [PubMed] [Google Scholar]
- 20.Li SP, Padhani AR. Tumor response assessments with diffusion and perfusion MRI. J Magn Reson Imaging. 2012 Apr;35(4):745–63. doi: 10.1002/jmri.22838. [DOI] [PubMed] [Google Scholar]
- 21.Padhani A, Hayes C, Landau S, Leach MO. Reproducibility of quantitative dynamic MRI of normal human tissues. NMR Biomed. 2002;15:143–53. doi: 10.1002/nbm.732. [DOI] [PubMed] [Google Scholar]
- 22.Piechnik SK, Ferreira VM, Dall’Armellina E, Cochlin LE, Greiser A, Neubauer S, et al. Shortened Modified Look-Locker Inversion recovery (ShMOLLI) for clinical myocardial T1-mapping at 1.5 and 3 T within a 9 heartbeat breathhold. J Cardiovasc Magn Reson. 2010 Jan;12:69. doi: 10.1186/1532-429X-12-69. [DOI] [PMC free article] [PubMed] [Google Scholar]
- 23.Schelbert EB, Testa SM, Meier CG, Ceyrolles WJ, Levenson JE, Blair AJ, et al. Myocardial extravascular extracellular volume fraction measurement by gadolinium cardiovascular magnetic resonance in humans: slow infusion versus bolus. J Cardiovasc Magn Reson. 2011;13:16. doi: 10.1186/1532-429X-13-16. [DOI] [PMC free article] [PubMed] [Google Scholar]
- 24.Sado DM, Flett AS, Banypersad SM, White SK, Maestrini V, Quarta G, et al. Cardiovascular magnetic resonance measurement of myocardial extracellular volume in health and disease. Heart. 2012;98(19):1436–41. doi: 10.1136/heartjnl-2012-302346. [DOI] [PubMed] [Google Scholar]


