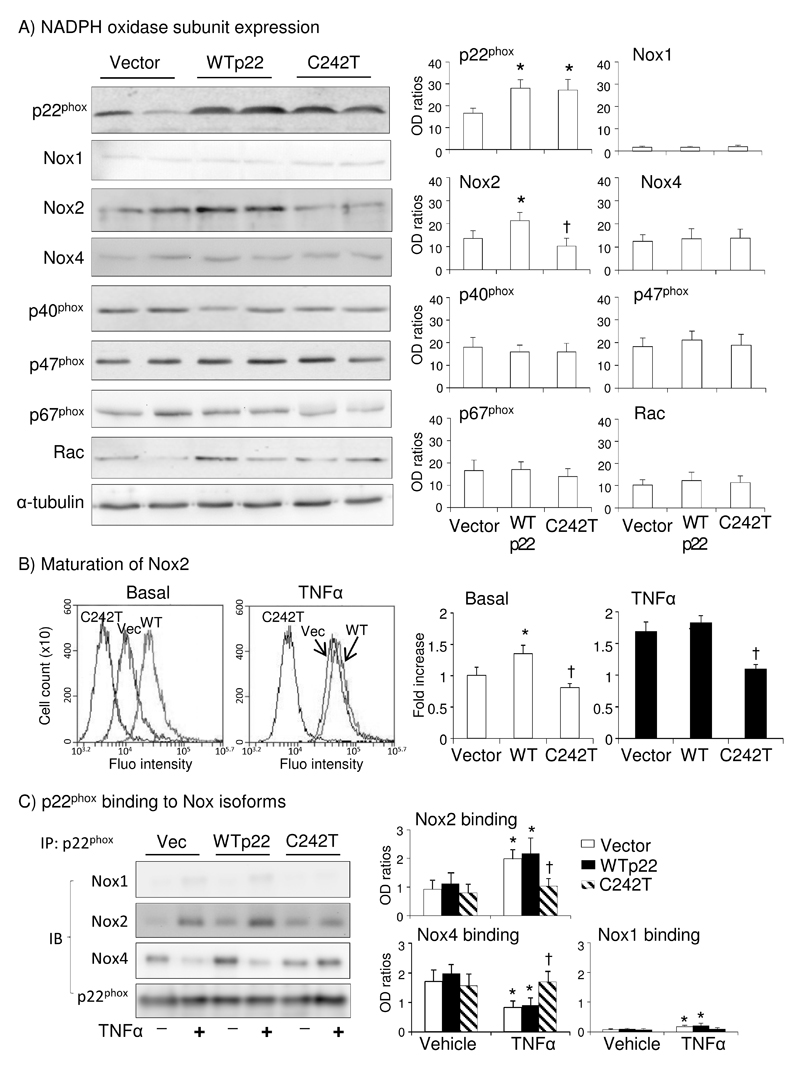
Figure 4. NADPH oxidase subunit expression, Nox2 maturation and binding to p22phox in HPMEC.
A) Western blots. Optical densities (OD) of protein bands of p22phox, Nox1, Nox2, Nox4, p47phox, p67phox, p40phox and Rac1/2 were quantified and normalized to the levels of α-tubulin (loading control) detected in the same samples. (B) Flow cytometry for the binding of Nox2 antibody (7D5). *p<0.05 for indicated values versus to vector values. †p<0.05 for indicated values versus WT values. (C) Left panel: p22phox was immunoprecipited (IP) followed by immunoblotting (IB) of Nox1, Nox2 and Nox4. Right panels: Optical densities (OD) of protein bands were quantified and normalized to the levels of total p22phox detected in the same samples. *p<0.05 for indicated values versus vehicle values under the same gene transfection. †P<0.05 for indicated values versus WT TNFα values. n=4 independent experiments.

