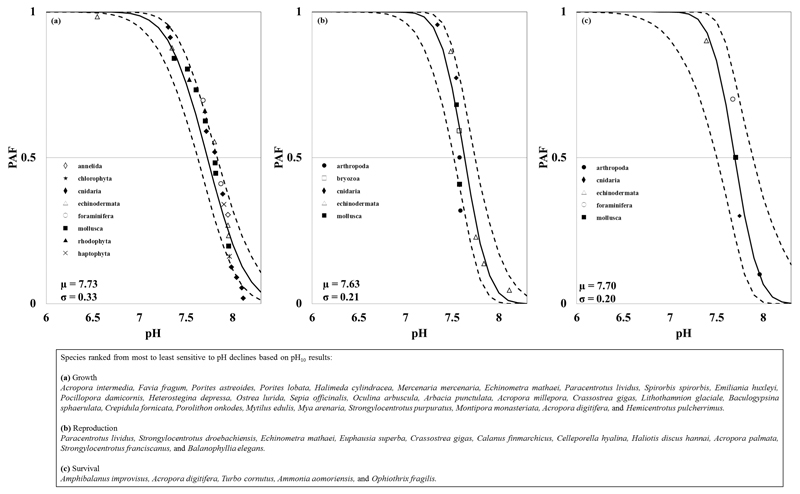
Figure 2.
Potentially affected fraction (PAF, continuous line) using pH10 values for (a) growth, (b) reproduction, and (c) survival. The μ and σ are the mean and standard deviation of pH10 used in the derivation of the PAF. The bottom right box shows the rankings of species sensitivity to pH declines.

