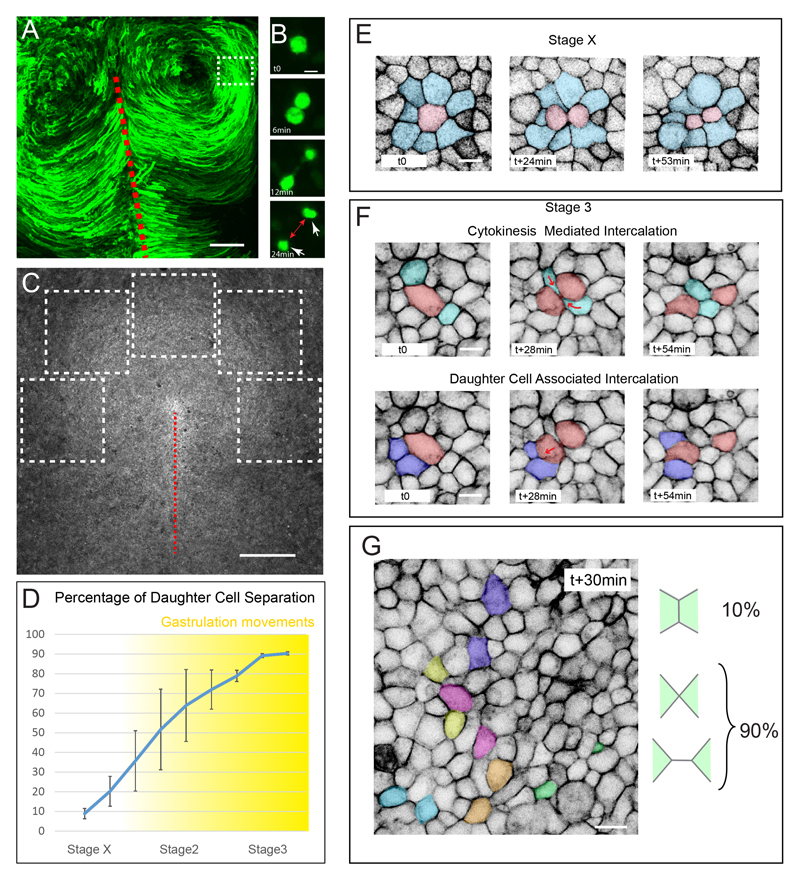
Figure 1. Cell division drives epithelial cell intercalation.
(A) Maximum projection of time series from a 3-hour time-lapse experiment of a chick embryo electroporated with a GFP reporter gene, showing the counter rotational movements of epiblast cells at stage 3+, the primitive streak is indicated by a red dotted line.
(B) Time series in a region away from the primitive streak equivalent to the boxed region in (A) showing that upon cell division, daughter cells (white arrow) separate away from each other (red arrow).
(C) Dorsal view of a stage3 memGFP transgenic chicken embryo acquired with a 10x and the tiling/stitching module of the confocal microscope. The dotted white boxes depict the regions analyzed in (D)
(D) Percentage of daughter cell separation following cell division between stage X and 3+. Cell separation was scored every 2 hours, n=2997, 7 embryos.
(E and F) Time series of a stage X (E) and stage 3 (F) memGFP transgenic chick embryo highlighting the fate of a dividing cell (in red) and its immediate neighbors (in blue). At stage X (E) daughter cells do not rearrange.
(G) Image of a memGFP transgenic chick embryo from a time-lapse experiment highlighting daughter cells (colored cells) that have rearranged within 30min after cell division.
Scale bar is 200μm in (A), 500μm in (C) and 10μm in (B and E-F). See also Movies S1 and S2.

