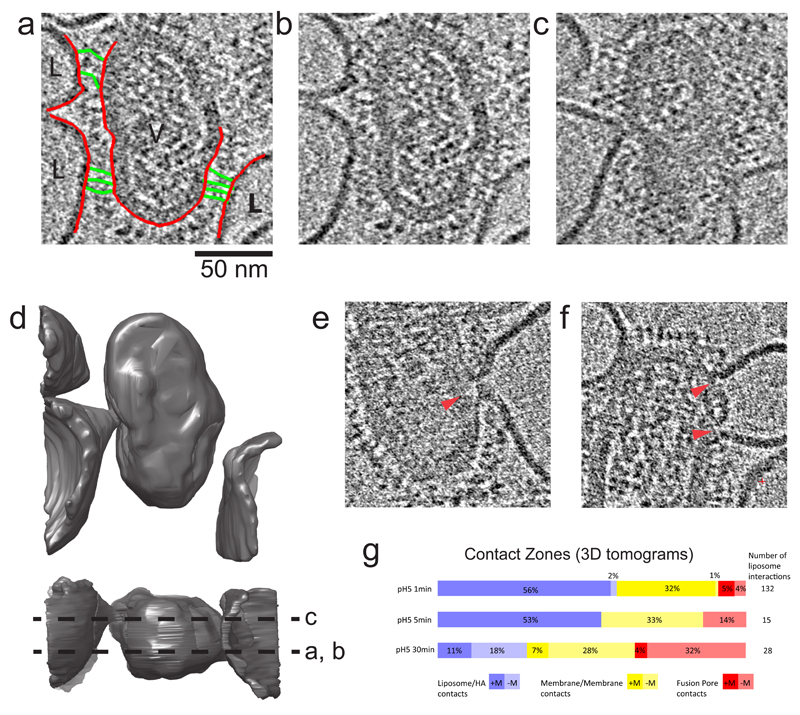
Figure 4. 3D Contact Zones.
(a,b) Identical sections of a tomogram showing glycoprotein attachments from a single virus particle to 3 liposomes. In (a), membranes are colored red, and HA extended intermediates are colored green. (c) Section of the same tomogram but 160 Å away from panel a,b showing membrane deformation of liposomes interacting with the virus particle. Glycoprotein-lipid contacts are also observed around these deformations indicating a wide zone of contact. (d) Surface rendering of virus and liposome membranes in tomogram giving rise to sections in panels b and c. The lower orthogonal view indicates the locations of sections shown in b and c by dotted lines. (e) Tomogram section showing contact zone with single fusion pore (full context in Supplementary Fig. 2) and (f) double fusion pore, local disruption of the matrix layer indicated by red arrows.
(g) Classification of 3D contact zones at the time intervals 1, 5, and 30 mins. Each of the 3 categories shown here are subdivided to show the presence (+) or absence (-) of the matrix protein (M1) layer at the localised point of virus/ liposome contact.

