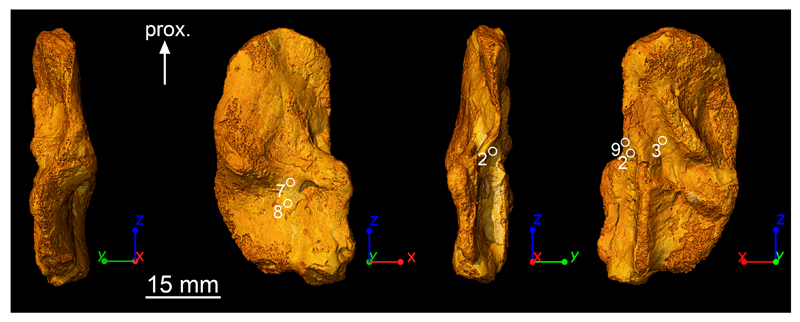
Extended Data Figure 4. Regions where high-resolution scans were made.
Skeletochronological observations were done at submicron resolution in nine homologous regions of the four humeri of Acanthostega. The specimen MGUH 29020 is used here to illustrate the regions providing quantifiable information to calculate annual bone growth rates (Extended Data Table 1). Areas of muscle insertions were avoided when possible. Regions 2, 3 and 9 are non-muscle attachment areas. Regions 7 and 8 are located between two regions of muscle insertions but annual bone growth rates (Extended Data Table 1) were only measured in undisturbed cortical parts exhibiting regular LAG patterns.

