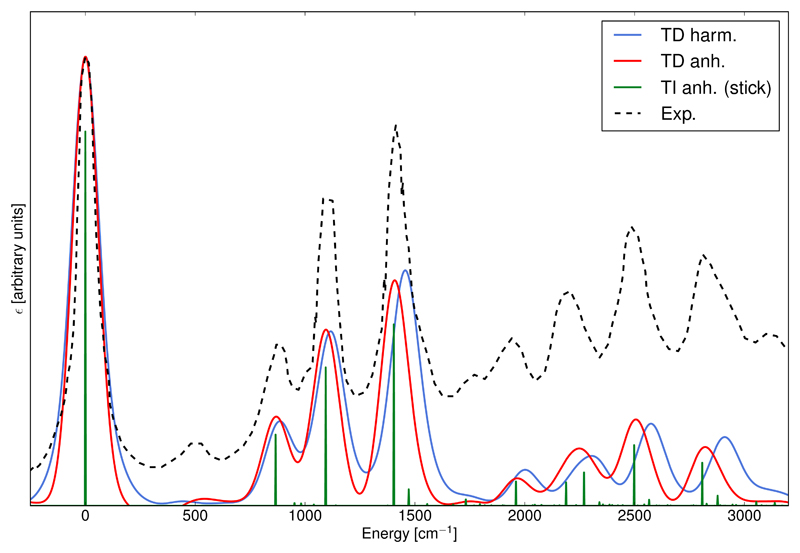
Figure 3.
Experimental and calculated X̃2A2 ← X̃1A1 photoionization spectra of furan. The convoluted spectra were simulated with the path integral (TD) approach using Gaussian distribution functions with HWHM=70 cm−1. The anharmonic spectrum (in red) differs from its harmonic counterpart (in blue) by the use of anharmonic vibrational energies instead of the harmonic ones. The stick spectrum was calculated with the sum-over-states approach using anharmonic frequencies. All computed spectra were done at the AH|FC level at T=0K in vacuum. The experimental spectrum (dashed black line) was taken from Ref.91,92

