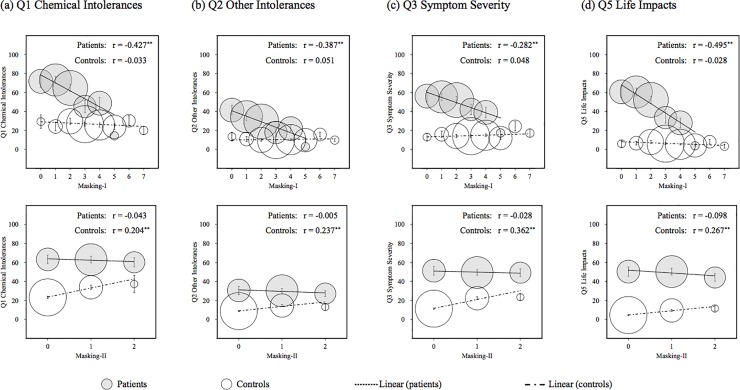
Fig 3. Scatter plots of the interaction between Masking-I or Masking-II and the other four scales in QEESI.
Error bars indicate standard errors. The area of each circle indicates the proportion of participant numbers. The r is Spearman’s correlation coefficient and ** indicates p < 0.01. QEESI, Quick Environmental Exposure Sensitivity Inventory.

