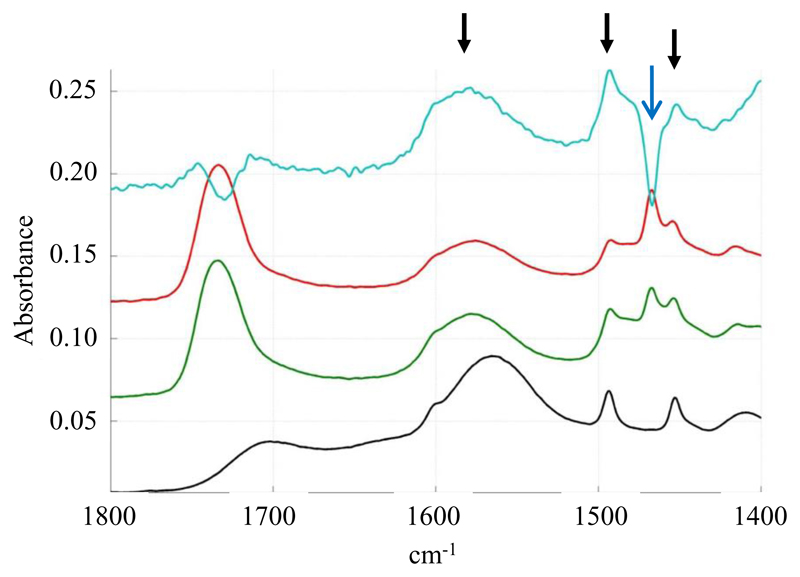
Figure 5.
Dichroic spectrum of SMALPs: Black: non polarized spectrum of SMALPs (DMPC), Green/red: polarized (0° and 90°) spectra of SMALPs, Blue: Dichroic spectrum of SMALPs. Black arrows show the positive deviation of SMA bands while the blue arrow shows the negative deviation of the lipid CH2 bending band.

