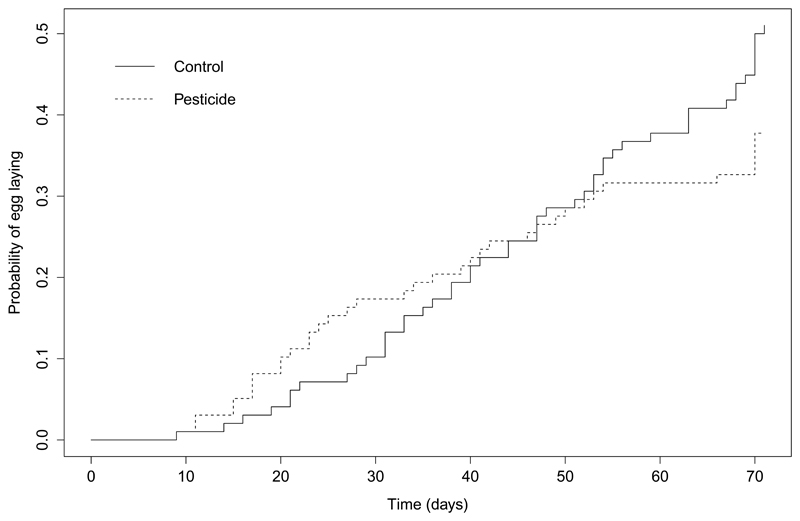
Figure 2.
The event history curve showing the cumulative probability of egg laying from the end of hibernation (time = 0 days) until the first egg was laid, by B. terrestris queens exposed to either the pesticide thiamethoxam, or a control. Total sample size for each treatment group: control group = 98; pesticide group = 99 (includes queens which survived the whole experiment only).

