Figure 3.
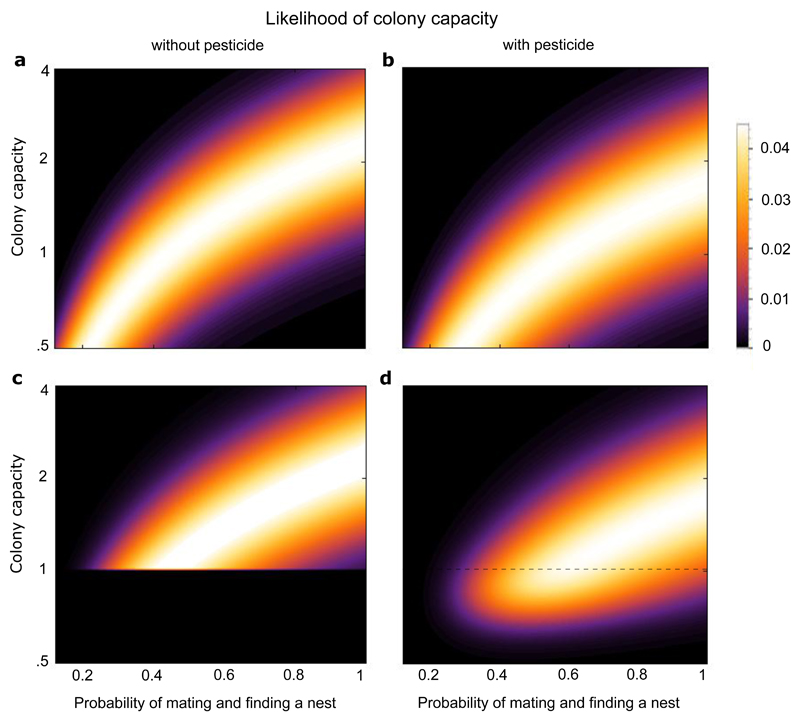
Heat maps showing the likelihood profile for the colony capacity with (panels b and d) or without thiamethoxam exposure (panels a and c). The heat maps in Figure 3 represent the probability distribution (normalised likelihoods) of the colony capacity (where lighter colours indicate higher probability, see scale to right of graphs) as a function of pnm, the probability with which queens successfully mate and find a new nest site in the natural environment, and the colony capacity itself. The colony capacity is the product of pnm with the number of gynes produced76, the probability to survive hibernation42 and the probability to be able initiate a colony following survival.
Panel (a) depicts the probability that the colony capacity takes a certain value, for different values of pnm, (using data from75, 42). Panel (b) shows the likelihood profile of colony capacity after exposure to thiamethoxam: the distribution is lower than in panel (a) due to the reduction in colony initiation (as found in our empirical results, see Supplementary Material for methodology). Panel (c) shows the likelihood profile of the colony capacity without exposure to thiamethoxam, conditioned to take a value of at least one to take account that the natural bumblebee population of B. terrestris is extant. The colony capacity must therefore be at least one. The likelihoods for the colony capacities below one are therefore set to zero, and the profile renormalised. Panel (d) shows the likelihood profile for the colony capacity as in (c) after the effect of thiamethoxam exposure was taken into account. Because of the reduction in colony initiation caused by thiamethoxam exposure colony capacities below one a have positive probability. The total probability of a colony capacity below one is found by integrating all probabilities below the dashed line in Fig. 3d.

