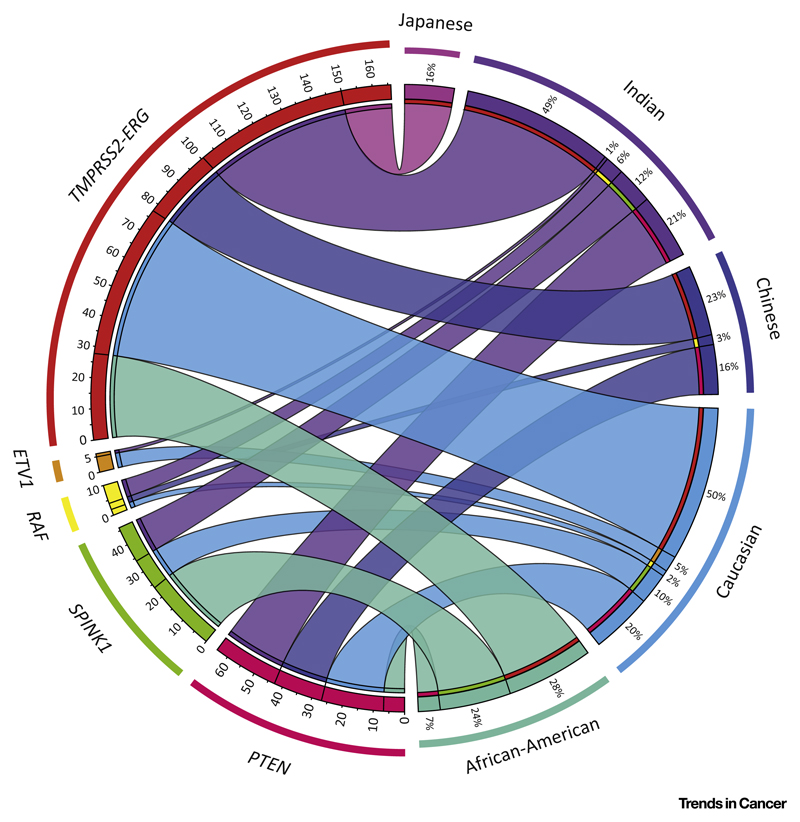
Figure 1. Racial Differences in Prostate Cancer (PCa) Molecular Subtypes.
Integrated Circos plot shows the correlation between molecular subtypes of PCa and their prevalence in different ethnic groups. Individual ethnic groups (on the right) are represented in different colors and corresponding colored ribbons connect each ethnic group to various molecular aberrations (on the left). The width of the individual ribbon denotes the prevalence of a molecular subtype in a given ethnic group.

