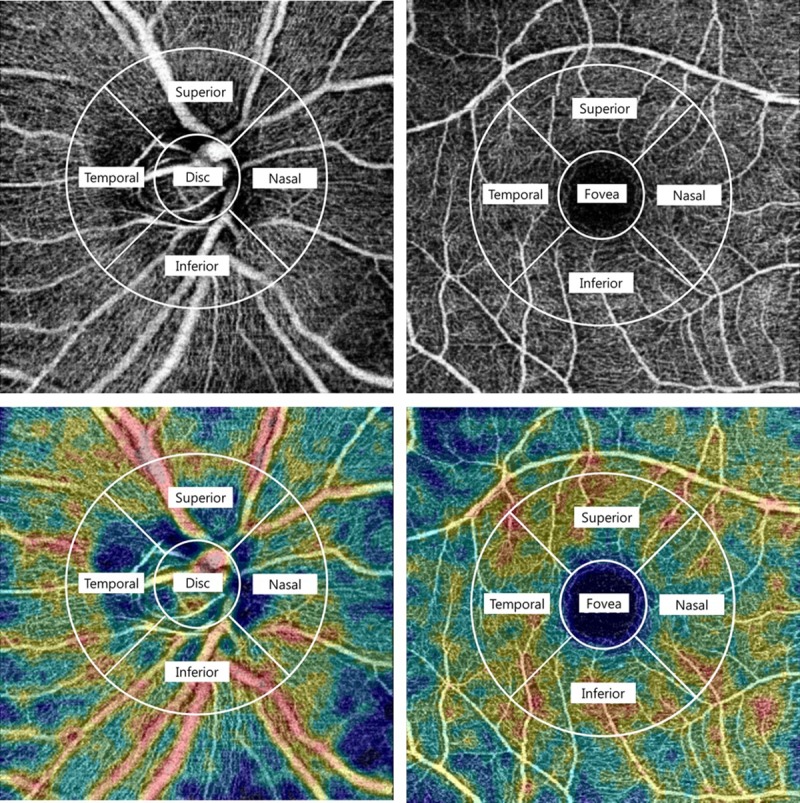
Fig 1. Swept-source optical coherent tomography angiography (SS-OCTA) scan and of the peripapillary area and macula showing superficial vascular plexus.

Swept-source optical coherent tomography (SS-OCT) scan (4.5 x 4.5 mm) of the peripapillary area and macula showing superficial vascular plexus as entire en face region (top). The value of the retinal vessel density (RVD) was calculated based on the intensity of the OCTA image. The “Density Map” (bottom) is a color map generated according to the brightness averages of the OCTA images.
