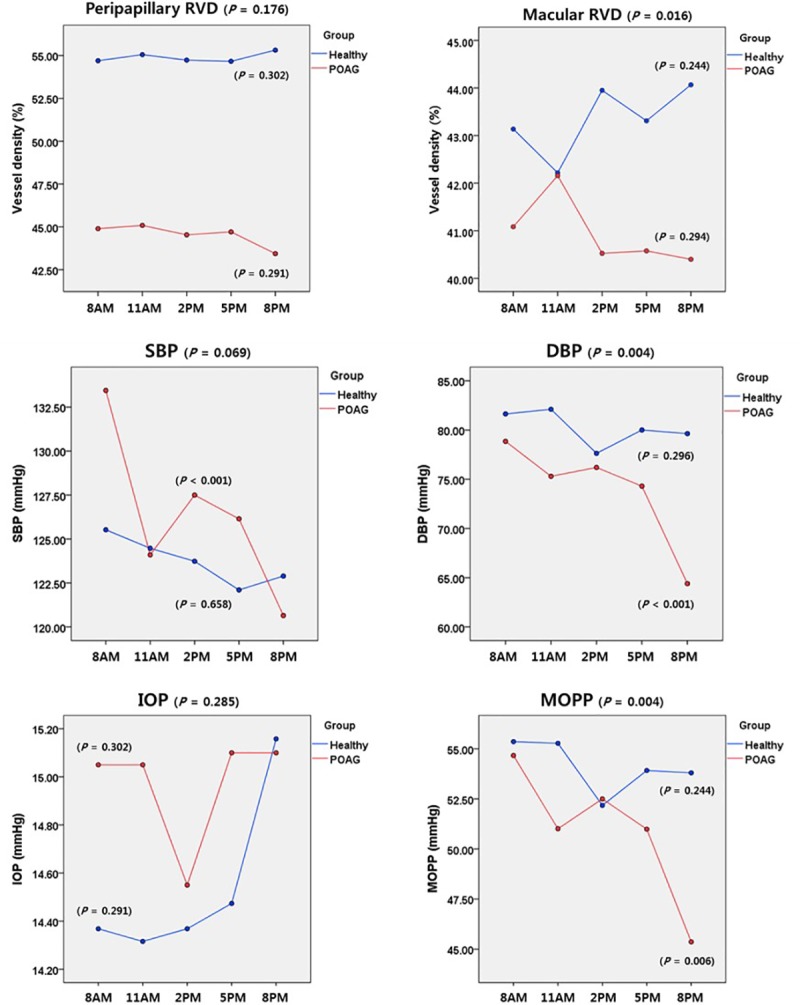
Fig 2. Patterns of diurnal variation of RVD and hemodynamic parameters in healthy subjects and POAG patients.

The average RVDs in the peripapillary (optic disc head, superior, inferior, temporal, nasal) and macular (fovea, superior, inferior, temporal, nasal) areas are shown at the top. SBP, DBP, IOP, and MOPP were recorded every 3 hours from 8 a.m. to 8 p.m. The RVD and hemodynamic variations in each group were analyzed by ANOVA, and the inter-group comparison was assessed by a linear mixed model.
