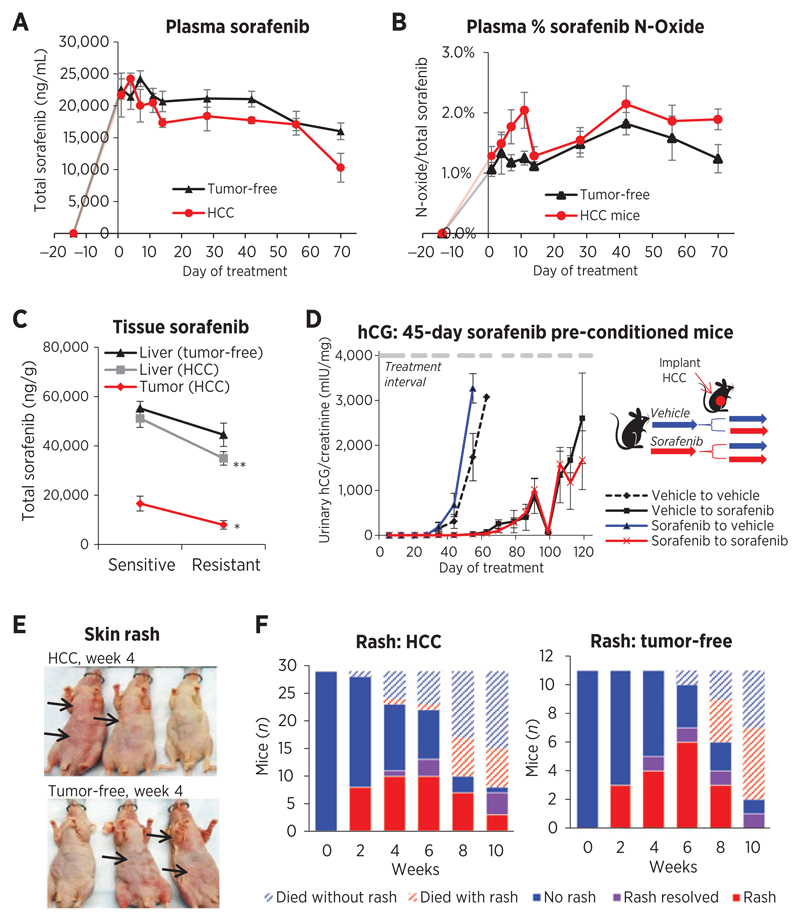
Figure 2.
Tumor impact on drug concentrations and resistance, and variation in rash development. A, total sorafenib plasma concentrations sampled 3 hours after dosing tended to decline in tumor free (R2 = 0.813 days 7–70; P = 0.0055) and Hep3B-hCG–bearing (HCC) mouse plasma (R2 = 0.723 days 4–70; P = 0.0075) but drug levels were generally higher in tumor-free mice. The tumor (P = 0.0196) and time (P < 0.0001) significantly impacted drug levels (two-way ANOVA). B, the %N-oxide metabolite/total sorafenib was marginally higher in HCC mouse plasma (two-way ANOVA, P = 0.0063 tumor; P = 0.1107 time) and peaked in HCC mice day 11 (t test, P = 0.0372). C, sorafenib concentrations declined significantly from sensitive to resistant phases in the liver (P = 0.00184; n = 10–11) and tumor (P = 0.0192; n = 8–9) of HCC mice but not in tumor-free mouse livers (P = 0.232; n = 6). *, P < 0.05; **, P < 0.01. D, SCID mice preconditioned for 45 days with 30 mg/kg sorafenib and subsequently implanted orthotopically with parental tumors developed resistance at the same rate as vehicle preconditioned mice (n = 4–5). E, skin rash toxicity frequently developed in tumor-free and HCC athymic nu/nu mice (arrow) when mice were sorafenib responsive. F, rash eventually improved weeks 4+ in mice, potentially relating to drug level decline.

