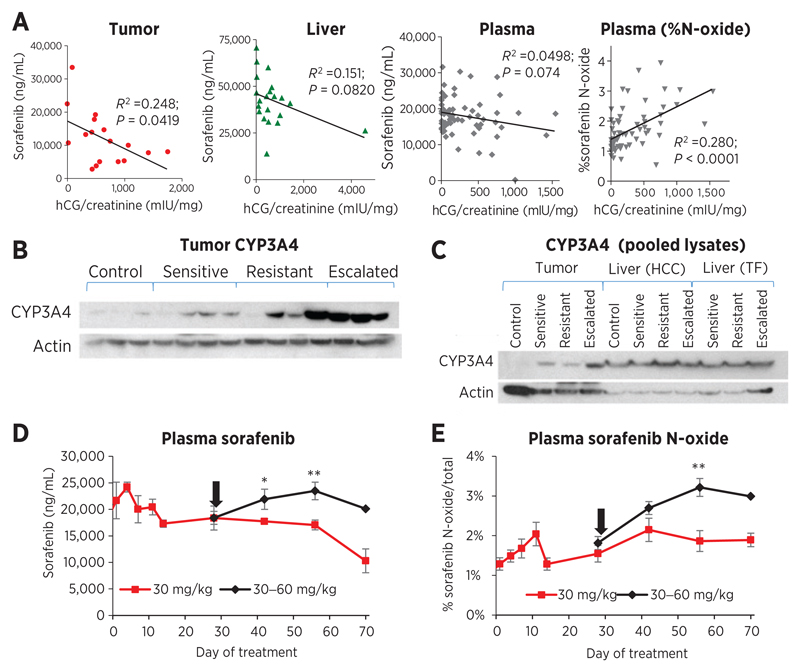
Figure 3.
sorafenib levels are associated with tumoral drug metabolism. A, tumor burden (hCG) in 30 mg/kg sorafenib-treated mice (all time points for plasma; sensitive and resistance time points for tissues) correlated significantly with tumor total sorafenib concentrations (R2 = 0.248; P = 0.0419) and plasma %N-oxide (R2 = 0.280; P < 0.0001), suggesting a link with drug metabolism. Correlations for total sorafenib approached significance in the liver (R2 = 0.151; P = 0.0820) and plasma (R2 = 0.0498; P = 0.074). B, CYP3A4 protein in individual tumors was induced by 30 mg/kg sorafenib treatment and reinduced by escalation to 60 mg/kg. C, analysis of pooled lysates confirmed induction of CYP3A4 in tumor but not in livers (controls, n = 4; HCC, n = 9–10; tumor-free, n = 5–6). D and E, dose escalation increased sorafenib plasma concentrations (D) and the percentage N-oxide metabolite (E) in HCC mice, consistent with CYP3A4 expression (n = 10–12; *, P < 0.05; **, P < 0.01 vs. 30 mg/kg). Arrow, switch to 60 mg/kg.

