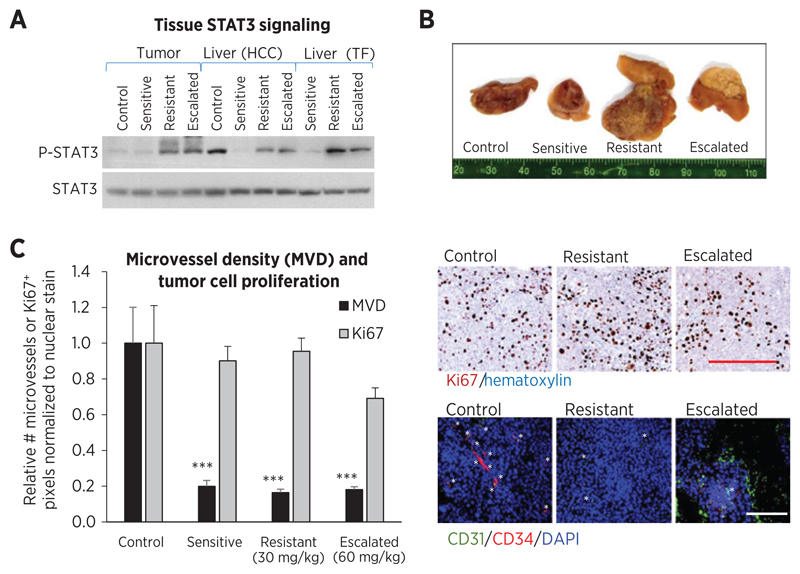
Figure 5.
Effects of sorafenib on cell signaling and antitumor activity. A, sorafenib treatment inhibited phosphorylation of downstream target STAT3 (P-STAT3) in livers (pooled lysates). P-STAT3 increased in tumors and livers of resistance phase HCC and tumor-free mice, but remained high in dose-escalated tissues, indicating some correlation with local drug levels. B, fixed tumor cross-sections show hemorrhagic control tumors and increasingly pale treated tumors. Dose escalated tumors were small and appeared necrotic/white. C, tumor cell proliferation (human Ki-67 immunostaining) did not significantly change during treatment (ANOVA, P = 0.082) but tended to decrease during dose escalation (t test, P = 0.0135 vs. resistant). Tumor microvessel density [CD31 (green) and CD34 (red) vessel counts normalized to DAPI (blue)] was significantly inhibited throughout 30 and 60 mg/kg sorafenib treatment (ANOVA, P < 0.0001; ***, P < 0.001), showing little association with drug levels. Right, representative images. Bar, 500 µm.

