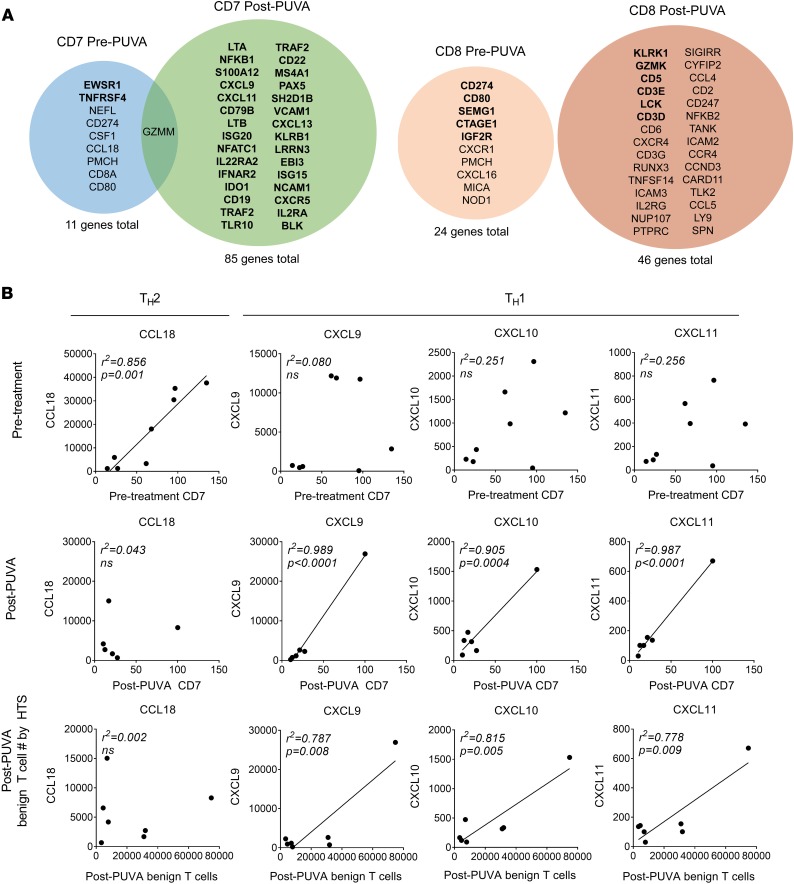
Figure 3. Benign T cells have distinct gene association profiles before and after therapy and PUVA induces a shift from Th2 to Th1 chemokine association.
(A) Gene expression before and after therapy was studied by NanoString and genes associated with the benign T cell population were assessed by Pearson’s correlations with CD7 and CD8A (CD8+ T cells only). CD7 was strongly correlated with the number of benign T cells as measured by HTS, validating the approach (Supplemental Figure 2). Genes associated with total benign cells had only 1 gene in common and CD8-associated genes before and after therapy were completely distinct. Genes in bold font: r > 0.9, P < 0.001. (B) PUVA induces a shift from Th2- to Th1-associated chemokines. The number of benign T cells, as assessed by CD7 gene expression levels (top 2 panels), correlated strongly with the expression of the Th2-recruiting chemokine CCL18 before but not after therapy and with the Th1-recruiting chemokines CXCL9, -10, and -11 after, but not before, therapy. Similar results were seen when the number of benign T cells was assessed by HTS (bottom panel). For mRNA expression and association studies, Pearson’s correlations were used to identify genes associated with CD7 or CD8A gene counts (as measured by NanoString). Genes with r > 0.8 and P < 0.01 were considered significant. For correlations, a Pearson’s correlation coefficient with a 2-tailed P value is reported.

