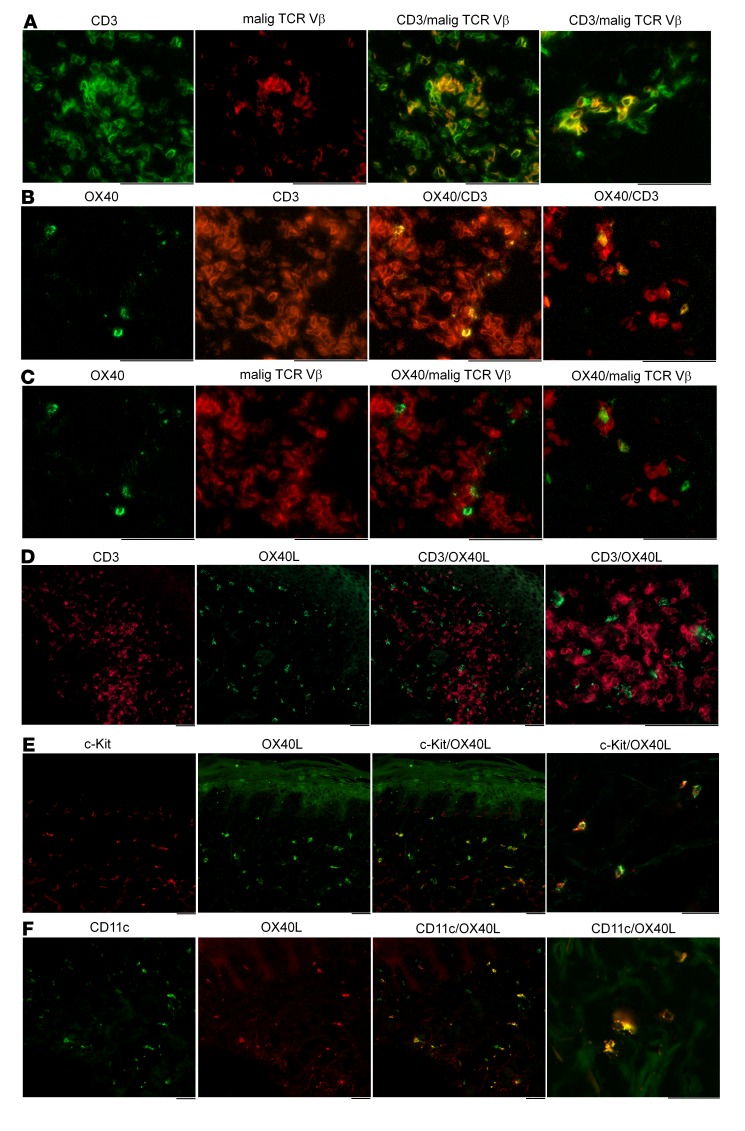
Figure 6. OX40 is expressed by benign T cells and OX40L is expressed by c-Kit+ dendritic cells in mycosis fungoides (MF).
(A) Malignant and benign T cells can be discriminated by costaining for CD3 and the TCR Vβ expressed by the malignant T cell clone, as identified by HTS. Malignant T cells costain for CD3 and the malignant T cell TCR Vβ (yellow) and benign T cells stain only for CD3 (green). Stained cells from a patient with high-burden stage IIA are shown; a second field from the same donor is shown in the last panel. (B) OX40 is expressed by T cells in MF. A patient with high-burden stage IIA CTCL is shown. A second field from the same donor is shown in the last panel. Similar results were observed in a total of 3 donors. (C) OX40 is expressed by benign but not malignant T cells. OX40 and malignant T cell TCR Vβ antibodies stained distinct populations of T cells. A patient with high-burden stage IIA MF is shown. A second field from the same donor is shown in the last panel. Similar results were observed in a total of 3 donors. (D) OX40L is not expressed by T cells in MF. Antibodies specific for CD3 and OX40L stained distinct cell populations. A patient with low-burden stage IA MF is shown. The last panel is a higher magnification view of the same staining; similar results were observed in a total of 5 donors. (E) OX40L is expressed by c-Kit+ cells in MF. OX40L and c-Kit were colocalized. Patients with high-burden stage IB (first 3 panels) and high-burden stage IA (fourth panel) MF are shown. Similar results were observed in a total of 3 donors. (F) OX40L-expressing cells are CD11c+ dendritic cells. A patient with high-burden stage IA (first 3 panels) and a second patient with high-burden stage IB (fourth panel) MF are shown. Staining demonstrating that OX40L+ cells lacked expression of tryptase is included in Supplemental Figure 4. All staining was performed on pretreatment skin biopsies. Results from additional patients are shown in Supplemental Figure 8. A color blind–accessible version of this image is provided in Supplemental Figure 9. Scale bars: 100 μm.

