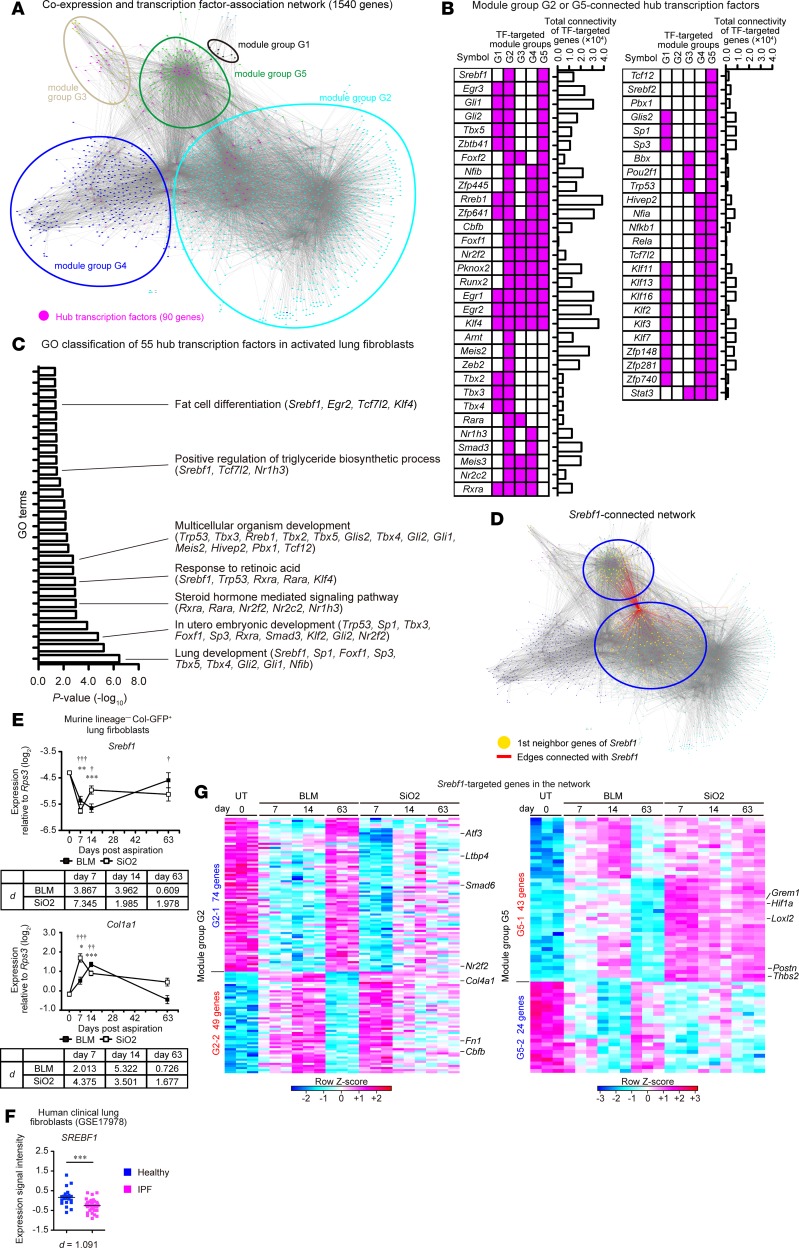
Figure 3. Transcriptome network analysis identifies hub transcription factors connected with fibrosis-associated gene modules in activated lung fibroblasts.
(A) Reconstructed transcriptome network of activated lung fibroblasts in pulmonary fibrosis. Each node represents genes, colors of each node represent module groups, and gray lines represent individual interactions. Hub transcription factors (TFs) are highlighted in magenta. (B) Pattern of the connection (magenta) between hub TFs and gene modules. Hub TFs that were connected with module groups G2 or G5 are shown. (C) Functional classification of 55 hub TFs using DAVID 6.8. Significantly enriched Gene Ontology (GO) terms and hub TFs included in GO terms are shown on the right of the graph. (D) Srebf1-connected network. Red line represents hub TF-target interaction. Targeted genes are highlighted in yellow. (E) qPCR analysis of Srebf1 and Col1a1 expression in activated lung fibroblasts. Data are presented as the mean ± SEM of n = 5 (UT, day 0; BLM, days 7, 63; SiO2, day 63), n = 6 (SiO2, day 7), n = 7 (BLM, day 14; SiO2, day 14). A representative result of 2 independent experiments is shown. Statistical significance is indicated as follows: *P < 0.05, **P < 0.01, ***P < 0.001 (untreated vs. BLM group); †P < 0.05, ††P < 0.01, †††P < 0.001(untreated vs. SiO2 group) according to 2-way ANOVA followed by the post hoc Tukey-Kramer’s multiple comparison test. Effect size (d) (compared with untreated group) is shown on the bottom of the graph. (F) Expression of SREBF1 in human lung fibroblasts derived from healthy (n = 19) or idiopathic pulmonary fibrosis (IPF) lungs (n = 37) (GSE17978). ***P = 0.0003 (2-tailed unpaired Student’s t test, t statistic [t] = 3.866, degree of freedom [df] = 54). Effect size (d) is shown on the bottom of the graph. (G) Heatmap representation of Srebf1-connected genes. Each column represents group and time point, whereas each row represents an individual gene. TF, transcription factor; Col-GFP, Col1a2-GFP reporter; BLM, bleomycin model; SiO2, silica model; UT, untreated.

