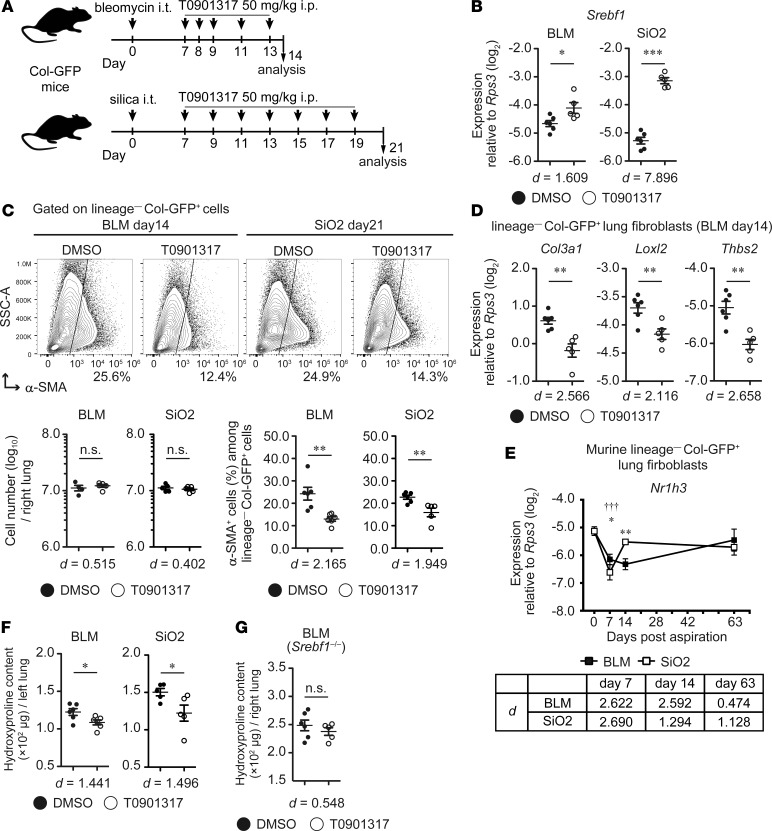
Figure 6. Pharmacological activation of LXR suppresses fibroblast activation and collagen deposition in murine pulmonary fibrosis.
(A) Experimental scheme of the treatment of bleomycin- and silica-induced pulmonary fibrosis by the LXR agonist T0901317. (B) qPCR analysis of Srebf1 expression in lung fibroblasts. (C) Changes in the number of lung fibroblasts and myofibroblasts in bleomycin- or silica-treated right lungs following T0901317 administration. (D) qPCR analysis of expression changes of trSrebf1c-targeted genes (detected by intratracheal transfer model of bleomycin-treated lungs; see Figure 5D) in the fibroblasts of bleomycin-treated lungs. (E) qPCR analysis of Nr1h3 expression in activated lung fibroblasts. (F) Changes in hydroxyproline content in the whole left lung of bleomycin- or silica-treated Col-GFP mice following T0901317 administration. (G) Changes in hydroxyproline content in the whole right lung of bleomycin-treated Srebf1–/–Col-GFP mice following T0901317 administration. (B and D) Graphs show the mean ± SEM (n = 6, DMSO; n = 5, T0901317). (C) Graphs show the mean ± SEM (n = 4, BLM day14 DMSO fibroblast number; n = 5, BLM day14 T0901317 and SiO2 day21 fibroblast number; n = 6, BLM day14 and SiO2 day21 DMSO, % of α-SMA; n = 5, SiO2 day21 T0901317, % of α-SMA). (E) Graphs show the mean ± SEM of n = 5 (UT, day 0; BLM, days 7, 63; SiO2, day 63), n = 6 (SiO2, day 7), n = 7 (BLM, day 14; SiO2, day 14). (F) Graphs show the mean ± SEM (n = 6, BLM, day14; n = 5, SiO2, day21). (G) Graphs show the mean ± SEM (n = 6, DMSO; n = 5, T0901317). Representative results of 3 (B–D and F) or 2 (E and G) independent experiments is shown. (B–D, F, and G) Statistical significance is indicated as follows: *P < 0.05; **P < 0.01, ***P < 0.001 (2-tailed unpaired Student’s t-test). Effect size (d) is shown on the bottom of the graph. (E) Statistical significance is indicated as follows: *P < 0.05, **P < 0.01 (untreated vs. bleomycin group), and †††P < 0.001(untreated vs. silica group) from 2-way ANOVA followed by the post hoc Tukey-Kramer’s multiple comparison test. Effect size (d) (compared with untreated group) is indicated at the bottom of the graph. Col-GFP, Col1a2-GFP reporter; BLM, bleomycin model, SiO2, silica model; SSC, side scatter.

