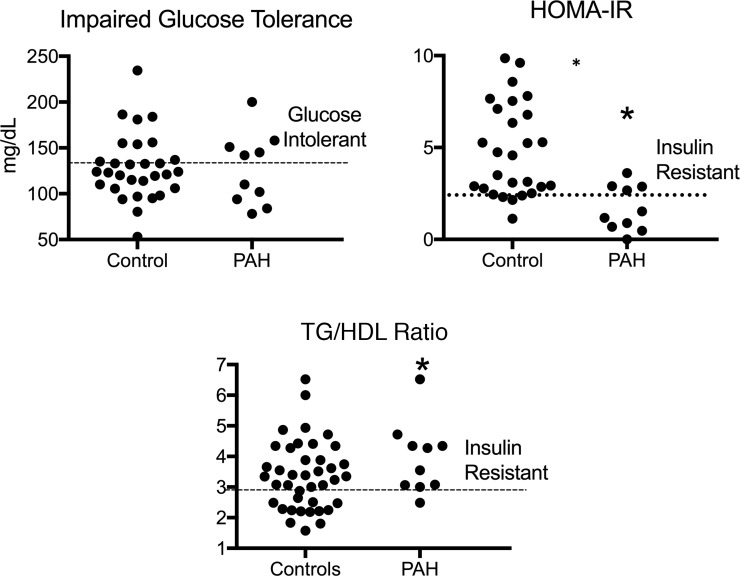
Figure 2. Prevalence of glucose intolerance and insulin resistance by glucose-based and lipid-based metrics in PAH and controls.
Frequency of impaired glucose tolerance was similar in PAH and controls (5 out of 10 PAH and 7 out of 30 controls, P = 0.11). Using a HOMA-IR ≥2.4 as a marker of IR, 4 out of 10 PAH patients were IR and 21 out of 30 controls were IR (*P < 0.05); 9 out of 10 PAH patients had elevated TG/HDL ratios, consistent with IR, while 17 out of 30 controls had IR with this lipid-based metric (*P = 0.01). TG/HDL, triglyceride/high density lipoprotein ratio; HOMA-IR, homeostatic marker assessment-IR. n = 10 PAH, 30 controls. Wilcoxon’s test used for all comparisons.

