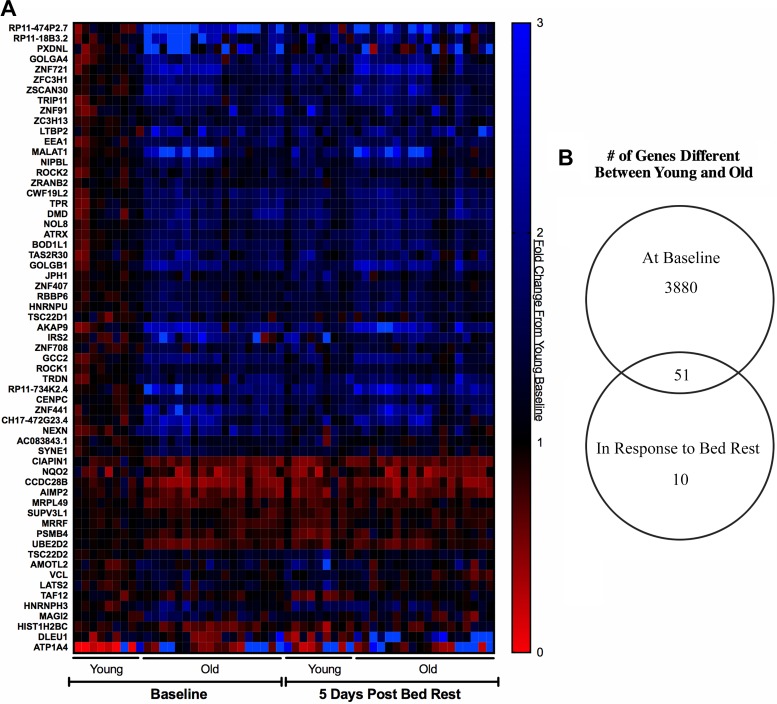
Fig. 2.
Differential regulation between Young and Old subjects after bed rest. A: heat map values are expressed relative to the average of the Young baseline gene expression values within each gene. Blue indicates higher expression, and red indicates lower expression. B: Venn diagram illustrating overlap of genes different between Young and Old at baseline and in response to bed rest. Statistical design included age + age:nested + age:time. Fold changes were determined with maximum-likelihood estimates of the log2 fold change. An adjusted P value of P < 0.05 was required for a gene to be considered significantly altered. n = 9 Young, 18 Old.

