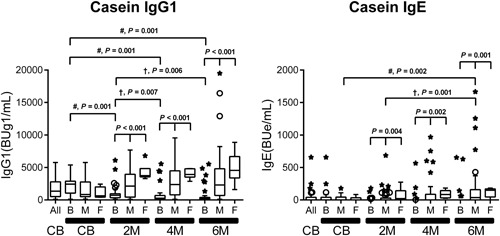
Figure 3.

Serial changes in feeding type‐related casein‐specific immunoglobulin G1 (IgG1) and IgE production in infants on breast milk (B), formula milk (F), and mixed (M) feeding from birth to 6 months of age. Data are the median (interquartile range) values of casein‐specific IgG1 and IgE in cord blood (CB), and in plasma at 2, 4, and 6 months (2 M, 4 M, and 6 M). In these box‐and‐whisker plots, lines within the boxes represent the median values; the upper and lower lines of the boxes represent the 25th and 75th percentiles, respectively; and the upper and lower bars outside the boxes represent the 90th and 10th percentiles, respectively. For statistical analysis, the CB samples were retrospectively divided into three corresponding groups. Differences among the three groups were analyzed by the Kruskal‐Wallis test. The differences (# and †) between two time points are described in Table S1: the Wilcoxon signed‐rank test with Bonferroni's correction. No significant difference was detected unless otherwise marked
