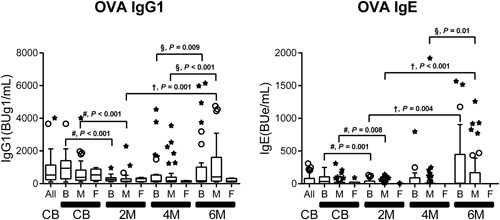
Figure 5.

Serial changes in feeding type‐related ovalbumin (OVA)‐specific immunoglobulin G1 (IgG1) and IgE production in infants on breast milk (B), formula milk (F), and mixed (M) feeding from birth to 6 months of age. The median (interquartile range) values of OVA‐specific IgG1 and IgE in cord blood (CB) and in plasma at 2, 4, and 6 months (2 M, 4 M, and 6 M). The difference #, vs CB, †, vs 2 months of age, and § vs 4 months of age, by the Wilcoxon signed‐rank test with Bonferroni's correction as described in Table S2. No significant difference was detected unless otherwise marked
