Figure 6.

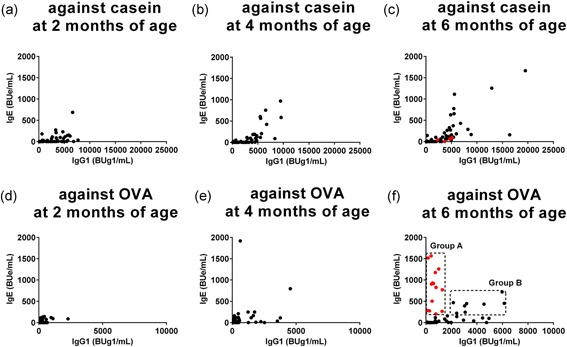
Serial changes in correlations between casein‐ and ovalbumin (OVA)‐specific immunoglobulin G1 (IgG1) and IgE levels in each infant group from 2 to 6 months of age. Changes in correlations between IgE and IgG1 levels in blood samples against casein (A‐C) and OVA (D‐F) were monitored in each infant group from 2 to 6 months of age. (F) Infants with IgE levels of greater than or equal to 200 BUe/mL were divided into red symbols infants in group A (n = 13), and black symbols infants in group B (n = 7), as described in the text
