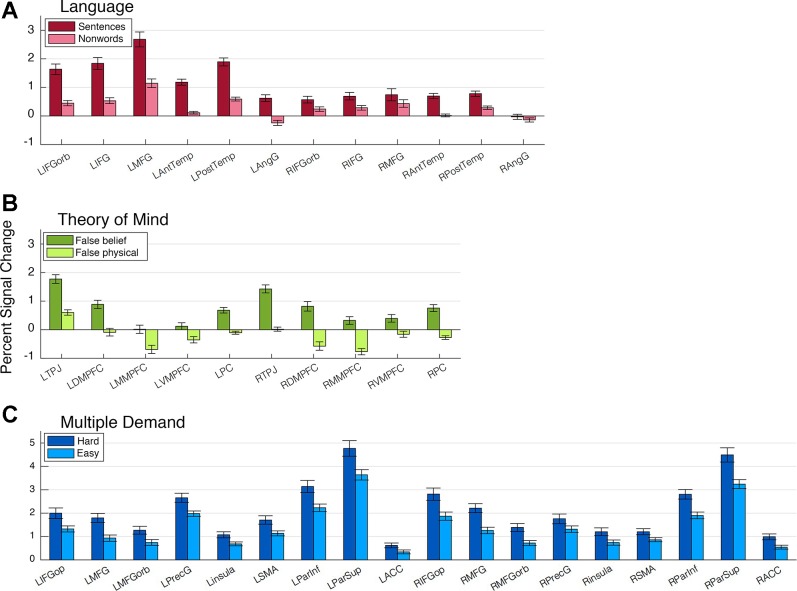
Fig. 3.
Responses of each network’s functional regions of interest (fROIs) to its localizer conditions. Bars correspond to percent signal change, relative to rest, in response to the target and control conditions of each localizer. The responses were estimated with twofold across-runs cross-validation, so that the data used for response estimation were independent from the data used for fROI definition. See glossary.

