Fig. 1.
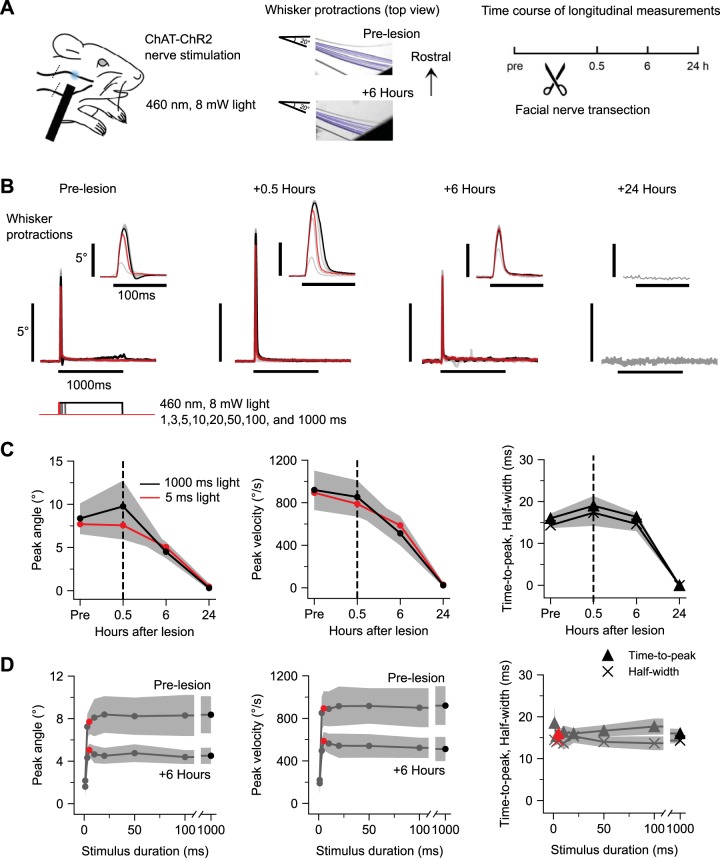
Functional degradation of facial nerve. A: optogenetic nerve paradigm. Left: schematic of transdermal facial nerve illumination in ChAT-ChR2 mice. Position of optogenetic illumination indicated with blue spot. Position of nerve transection indicated with diagonal lines crossing buccal and marginal nerve branches caudal to illumination site. Middle: frame-by-frame position of one tracked whisker in an example subject in response to a 1,000-ms, 8-mW pulse of 460-nm LED illumination prelesion and 6 h postlesion. Right: experimental timeline. B: whisker protractions evoked by optogenetic nerve stimulation from an example mouse at various times relative to nerve transection. Each trace is the average of 10 responses to a different duration of illumination at 8 mW. Stimuli are 1, 3, 5, 10, 20, 50, 100, and 1,000 ms, with 5 ms (red) and 1,000 ms (black) highlighted. Insets show the same traces on an expanded time scale. C: time course of peak amplitude (left), peak velocity (middle), and time-to-peak and half-width (right) of whisker protractions in response to 5-ms (red) and 1,000-ms (black) light stimuli. In all cases, responses were significantly abolished by 24 h posttransection (see text for further statistics). Values are means ± SE; n = 6 mice. D: prelesion and 6-h response duration families for peak amplitude (left) and peak velocity (middle). Prelesion response duration families for time-to-peak and half-width (right). Red circles and triangles, 5 ms; black circles and triangles, 1,000-ms stimuli. Values are means ± SE; n = 6 mice.

