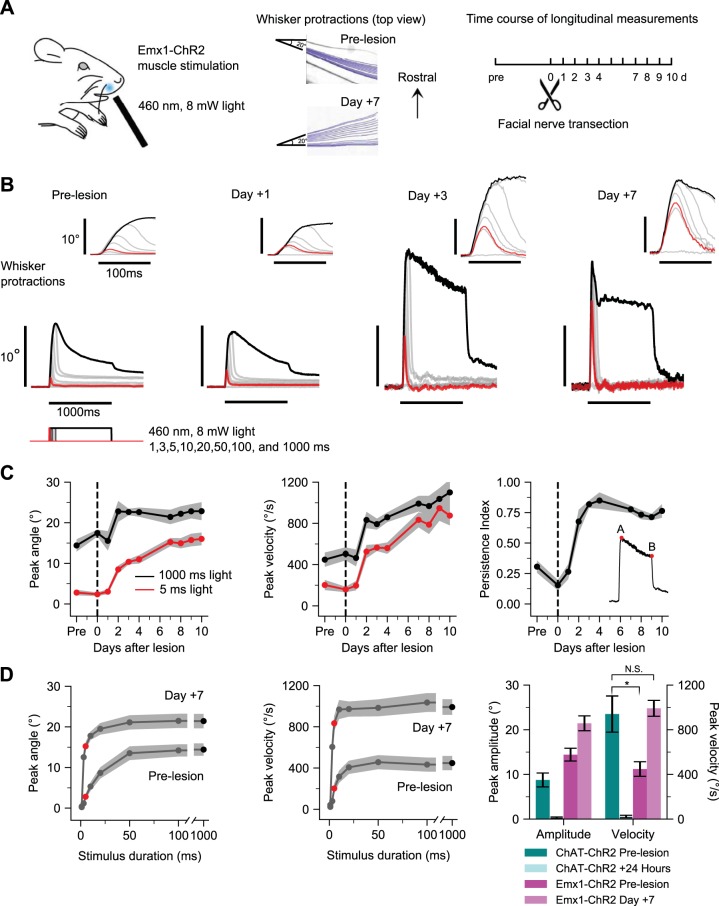
Fig. 3.
Functional enhancement of denervated muscle. A: optogenetic muscle paradigm. Left: schematic of transdermal muscle illumination in Emx1-ChR2 mice. Position of optogenetic illumination indicated with blue spot. Middle: frame-by-frame position of one tracked whisker in an example subject in response to a 1,000-ms, 8-mW pulse of 460-nm LED illumination prelesion and 7 days postlesion. Right: experimental timeline. B: whisker protractions evoked by optogenetic muscle stimulation from an example mouse at various times relative to nerve transection. Each trace is the average of 10 responses to a different duration of illumination at 8 mW. Stimuli are 1, 3, 5, 10, 20, 50, 100, and 1,000 ms, with 5 ms (red) and 1,000 ms (black) highlighted. Insets show the same traces on an expanded time scale. C: time course of peak amplitude (left) and peak velocity (middle) of whisker protractions in responses to 5-ms (red) and 1,000-ms (black) light stimuli. Time course of persistence index for 1,000-ms stimulus (right); inset shows that persistence index is the ratio of response amplitude at 1,000 ms (B) to peak amplitude (A). Values are means ± SE; n = 9 mice. D: prelesion and 7 days response duration families for peak amplitude (left) and peak velocity (middle). Red circle, 5 ms; black circle, 1,000-ms stimuli. Right: summary data comparing amplitude and velocity changes for ChAT-ChR2 (blue shading) and Emx1-ChR2 mice (magenta shading) in response to 1,000-ms stimuli. t-Tests compare velocity values for prelesion ChAT-ChR2 with prelesion Emx1-ChR2 and prelesion ChAT-ChR2 with day +7 Emx1-ChR2. Values are means ± SE; n = 9 mice. *P < 0.05, N.S., not significant.

