Fig. 4.
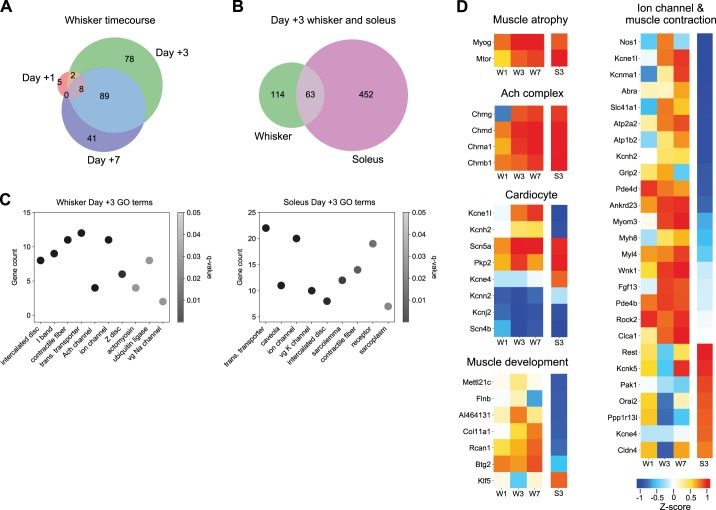
Transcriptome of denervated whisker pad muscle. A: Venn diagram of differentially expressed transcripts from whisker pad with at least ± 2-fold change (FC) at 1, 3, and 7 days postdenervation (n = 3 mice at each time point). B: Venn diagram of differentially expressed transcripts with ± 2-FC from whisker pad and soleus at 3 days postdenervation. Soleus data in B, C, and D is from Macpherson et al. (2015) (n = 2 mice). C: subset of enriched cell component GO terms for whisker pad (left) and soleus (right) at 3 days postdenervation. Identity numbers of GO terms are listed in methods. D: heatmaps of expression for gene families related to Muscle atrophy, ACh complex, Cardiocyte, Muscle development, and Ion channels and Muscle contraction groups. Data shown as average z-score. Columns labeled W1, W3, and W7 indicate whisker pad data from 1, 3, and 7 days postdenervation, respectively. Rightmost columns labeled S3 indicate soleus data from 3 days postdenervation. For Muscle development and Ion channel and Muscle contraction groups, genes included in heatmap were limited to those that had polar directional z-scores between whisker pad and soleus at 3 days. GO, gene ontology; trans., transmembrane; vg, voltage-gated.

