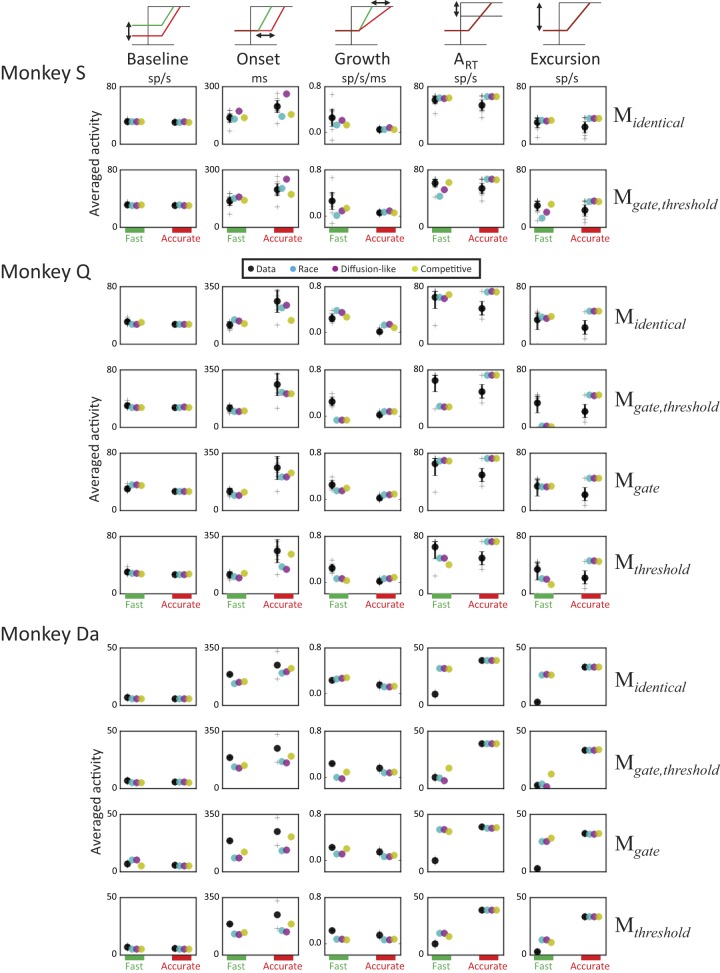
Fig. 6.
Movement neuron modulations and model predictions. Observed neural discharge rates and model accumulator trajectories were characterized by measuring baseline firing rate, onset of activation, growth rate, ART, and excursion between baseline and ART averaged across response time (RT) bins of trials for fast (left) and accurate (right) speed-accuracy tradeoff (SAT) conditions. Observed (black) and predicted values of each measure for each gated accumulator model (GAM) architecture (cyan: race; magenta: diffusion-like; yellow: competitive) are plotted together. Each plus sign plots the measure from one neuron. Black circles plot data averaged across neurons and are accompanied by a bootstrap 95% confidence interval. Colored circles plot predictions from each GAM architecture averaged across 1,000 simulations with parameter values obtained by fitting the model to behavioral data.

