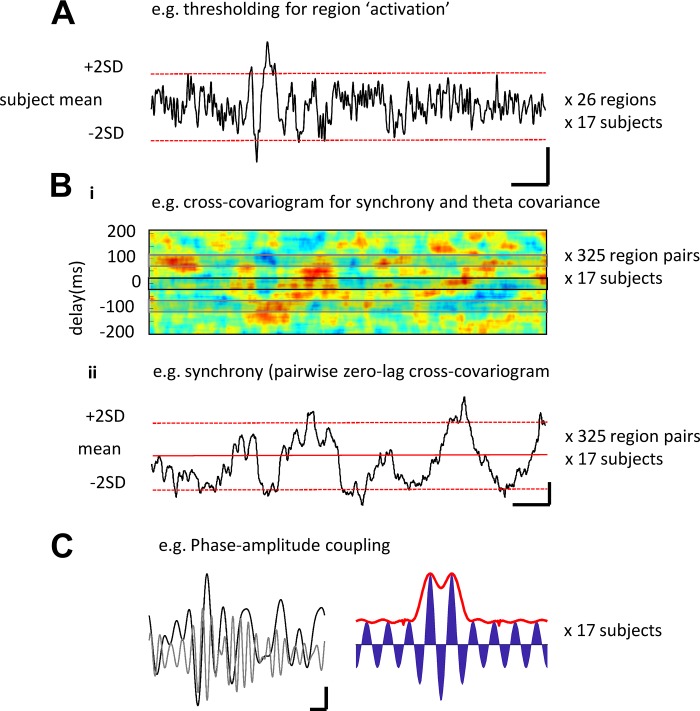
Fig. 1.
Example of methods used to quantify activity alone and by phase of delta and theta oscillation. A: example trace showing a single region’s mean (over trials) response pattern. Activation of the region was quantified as deviations of the magnetoencephalography (MEG) signal greater than 2SDs above the mean. Scale bar: 2 nA·m, 200 ms. B, i: example cross-covariogram (meaned over trials) for a single pair of regions in one subject over the time course shown for A). Time-variant cross-covariance was taken either at 0-ms delay or one half a theta period delay. B, ii: example of a time-variant cross-correlation at 0 ms from B, I, illustrating the thresholding used to define coactivation. Scale bar: 0.2 normalized covariance units, 200 ms. C, left: example delta (black line) and theta (gray line) bandpassed activity (1–4 Hz and 4.5–7.5 Hz, respectively). Data show the averages for all left cortical regions for one subject. Scale bar: 0.5 nA·m, 200 ms. Right: simulation of the effect of theta magnitude modulation (blue) by a single “delta” Gaussian. The resulting phase-amplitude coupling metric is shown in red.

