Fig. 2.
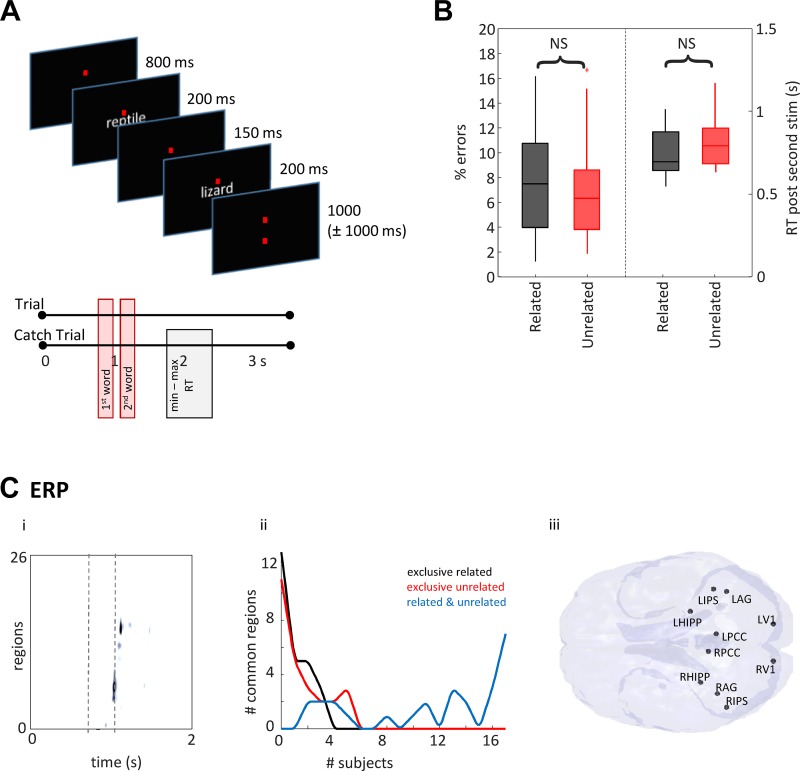
Raw response magnitude demonstrates common regions related to subjective task performance but does not predict outcome. A: pictorial examples from the task. B: percentage errors and reaction times after second stimulus for all subjects for the two conditions—related (black) and unrelated (red). C, i: an example of region activity changes with time. Data from one subject, averaged for “related” trials is displayed as colormap where regions form each row (arranged by time to maximal response). Trial time is along the x-axis and magnetoencephalography (MEG) region activations (>2 SD) are on the color axis. Times for stimulus onset are shown as dashed lines. Note region numbers (y-axis) were reorganized by time of initial activation and do not represent the numbers given in methods. C, ii: plot shows the number of active regions (>2 SDs from the mean signal from 0.8 to 2.0 s) across subject. Note no regions were common to more than 7/17 subjects when considering outcome (“related”—black line, “unrelated”—red line, “related” and “unrelated”—blue line). C, iii: map shows the location of each of the 10 regions found common to >15 subjects (94%) overlaid on a horizontal brain representation viewed from below.

