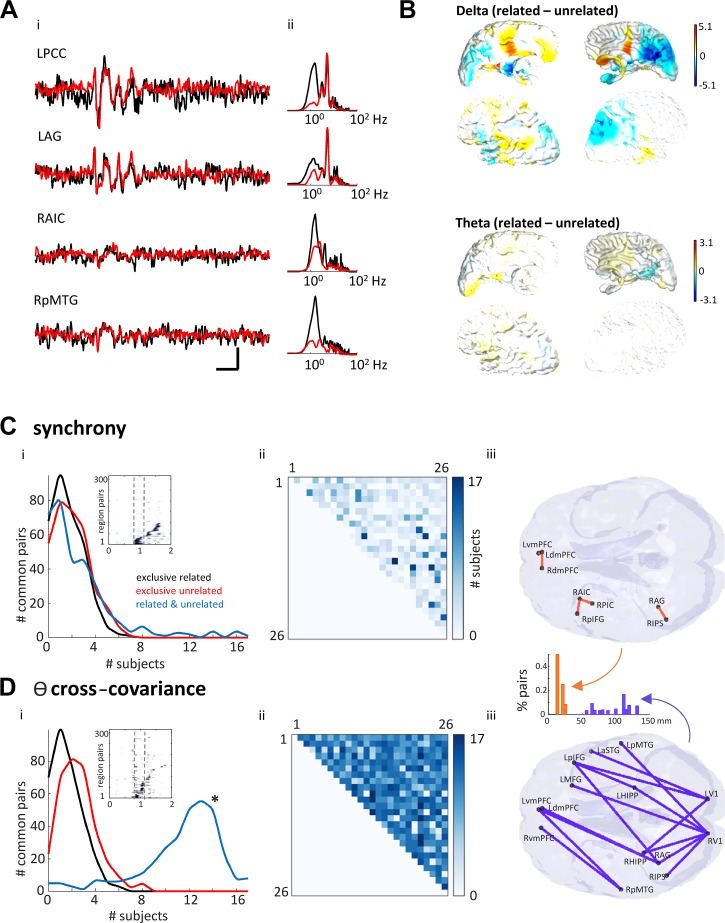
Fig. 3.
Synchrony and theta covariance differentially demonstrate common region pairs related to subjective task performance but do not predict outcome. A: average waveform (left) and spectrograms (right) for four example regions [left posterior cingulate cortex (LPCC), left angular gyrus (LAG), right anterior insular cortex (RAIC), and right posterior middle temporal gyrus (RpMTG)] averaged over all trials for one example in one subject for the related (black) and unrelated (red) conditions. Scale bar: 200 ms, 2 nA·m. B: mean (by subject) difference between “related” and “unrelated” delta and theta power shown as colormap of percent difference calculated for each point of grid of beamformed nodes with 5-mm spacing throughout the brain. Note that none of these regional differences was significant when corrected for multiple comparisons [family-wise error (FWE): P < 0.05 in specialized proresolving mediators (SPM)]. C, i: pairwise, normalized cross-covariance between regions demonstrated trajectories of synchrony above threshold (>2 SDs) from stimulus presentation (inset). Note region numbers (y-axis) were reorganized by time of initial activation and do not represent the numbers given in methods. Main graph shows number of region pairs with correlations >2 SDs above mean for each behavioral outcome. No synchronous region pairs were common to >8 subjects when separated into outcome (“related”—black line, “unrelated”—red line). 0-ms synchrony showed only five region pairs interacted in >15 subjects when considering task (blue line). C, ii: cross-covariance matrix of all region pairs, color-mapped onto commonality across the subject pool. C, iii: location of each of the five region pairs common to >15 (94%) of subjects. D, i: theta covariance between regions demonstrated trajectories from stimulus presentation (inset). Main graph shows number of region pairs with theta-lagged correlations >2 SDs above mean for each behavioral outcome. Theta covariance showed 14 region pairs interacted in >15 subjects when considering task (blue line). D, ii: cross-covariance matrix of all region pairs, color-mapped onto commonality across subjects. Dark colors compared with light colors indicate commonality in greater numbers of subjects. D, iii: location of each of the 14 region pairs common to >15 (94%) or subjects. Inset shows the distribution of interregional distances for interacting regions in each case. Note the significant (P < 0.05) shift from short- to long-distance functional connections when considering theta covariance (orange) versus synchrony (purple).

