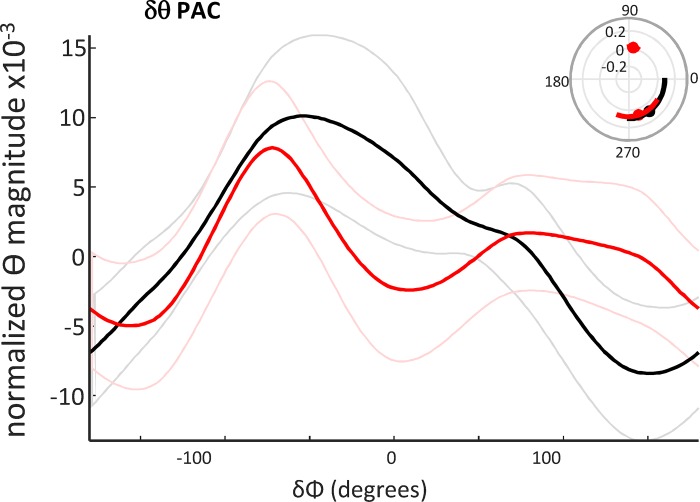
Fig. 4.
The profile of delta/theta phase amplitude coupling predicted semantic interpretation. Phase-amplitude coupling of region-averaged data, filtered for theta magnitude (4.5–7.5 Hz), with reference to the mean delta rhythm phase. The cross-frequency coupling profiles were significantly different (P < 0.05, n = 17, Kologmorov-Smirnov) when comparing activity before a “related” (black) versus an “unrelated” (red) interpretation. Inset: significant phase-amplitude coupling (PAC) epochs polar plotted by delta phase.

