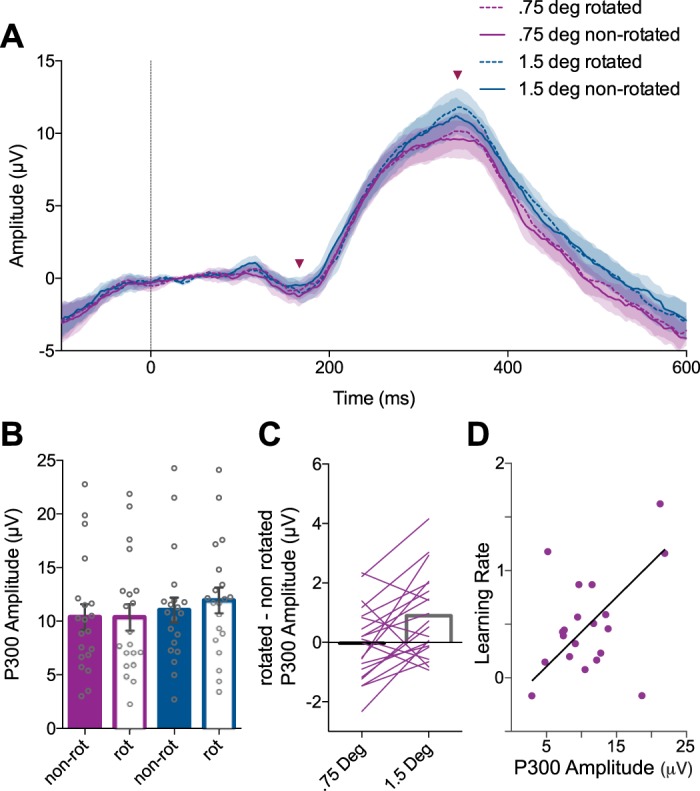
Fig. 8.

The P300 reflects sensory error processing during the visuomotor rotation task. A: trial-averaged event related potentials (ERPs) recorded from electrode Pz aligned to feedback presentation (0 ms, vertical line). Shaded regions: ±SE (n = 20). Arrowheads indicate the time points for the base and peak of the P300. B: the peak-to-peak amplitude of the P300 during the visuomotor rotation task (error bars: ±SE). C: P300 amplitude was larger for rotated than nonrotated trials in the 1.5° rotation condition but not the 0.75° rotation condition. D: P300 amplitude during adaptation predicted learning rate. Line of best fit corresponds to robust linear regression using iteratively reweighted least squares.
