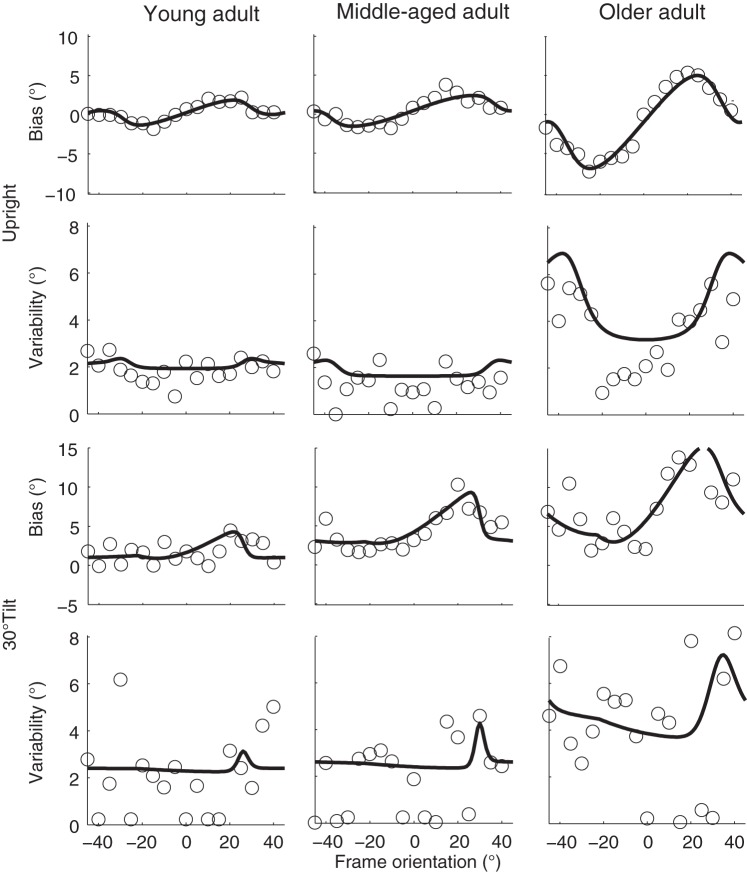
Fig. 3.
Bias and variability plotted against frame orientation for the 3 representative subjects in the upright (top two rows) and 30° tilt condition (bottom two rows). Solid lines represent the best-fit of the Bayesian optimal integration model of Fig. 1B.

