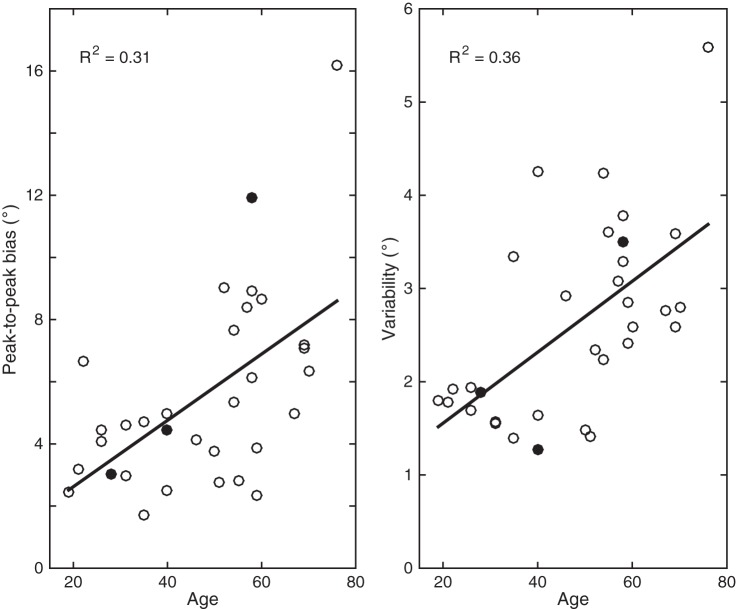
Fig. 4.
Peak-to-peak bias and response variability in the head-upright condition plotted against age. Peak-to-peak biases are calculated by fitting a sinusoid through the bias patterns. Solid lines represent the linear regression analysis, which is reported by the R2 correlation measure in each panel. Data points for the 3 exemplar subjects are closed circles.

