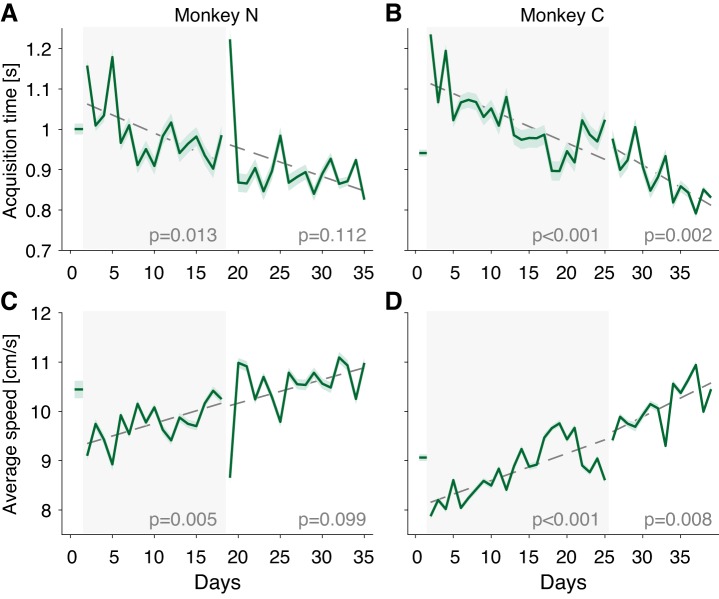
Fig. 3.
Efficiency in cursor movement increases gradually with practice. A and B: target acquisition time across days for monkeys N and C, respectively. Each data point represents the mean of the first 480 trials on each day; shaded area denotes SE. Dashed lines represent a linear regression fit as a function of time within each session, with the P values shown at bottom of the plot. C and D: average cursor speed of each trial across days for monkeys N and C, respectively. Data are from the same trials used in A and B.

