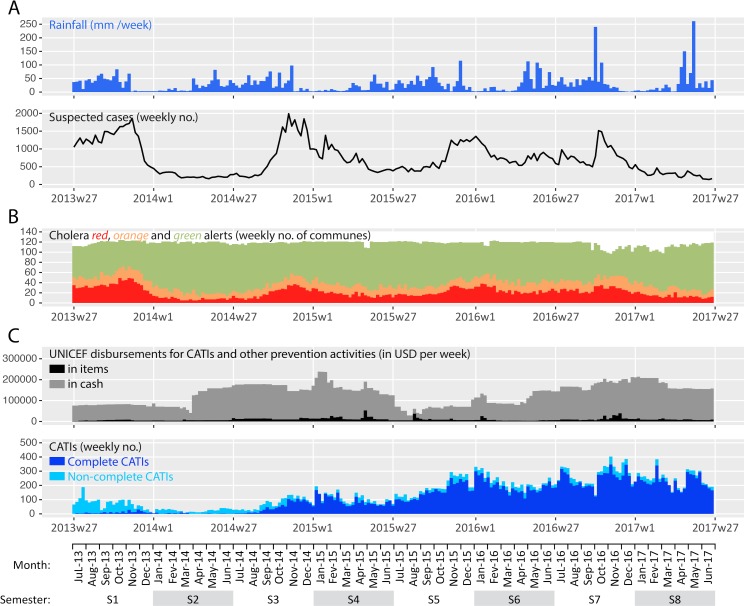
Fig 1.
Weekly evolution of accumulated rainfall and cases (Panel A), retrospective cholera alerts (Panel B), and implementation of the response strategy by UNICEF (Panel C) from mid-2013 (week 27) to mid-2017 (week 26). Cumulated rainfall data averaged over the entire country was obtained from NOAA. Suspected cholera case numbers were obtained from the routine surveillance databases provided by the MOH. Retrospective cholera alerts were computed for a preprint manuscript, based on cases, deaths and stool cultures positive for Vibrio cholerae O1 [19]. Details on UNICEF disbursements and rapid CATIs were provided by UNICEF (S1 Database).

