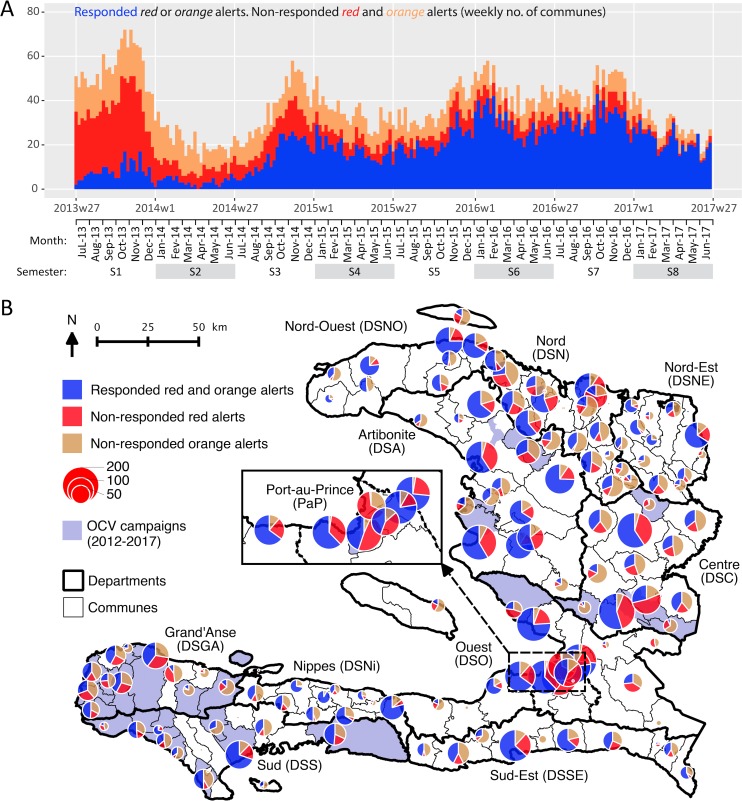
Fig 2.
Case-area targeted interventions (CATIs) in response to cholera alerts during the same week, from July 2013 to June 2017: weekly number (Panel A) and commune number (Panel B) of responded and non-responded red and orange alerts. Retrospective cholera alerts were computed based on case numbers, death numbers and stool cultures positive for Vibrio cholerae O1 [19]. CATI records were provided by UNICEF. Oral cholera vaccine (OCV) records were provided by the MOH. The map was created using QGIS v3.0.3.

